29
/
en
AIzaSyAYiBZKx7MnpbEhh9jyipgxe19OcubqV5w
April 1, 2024
168583
Kiribati
KIR
true
2
1
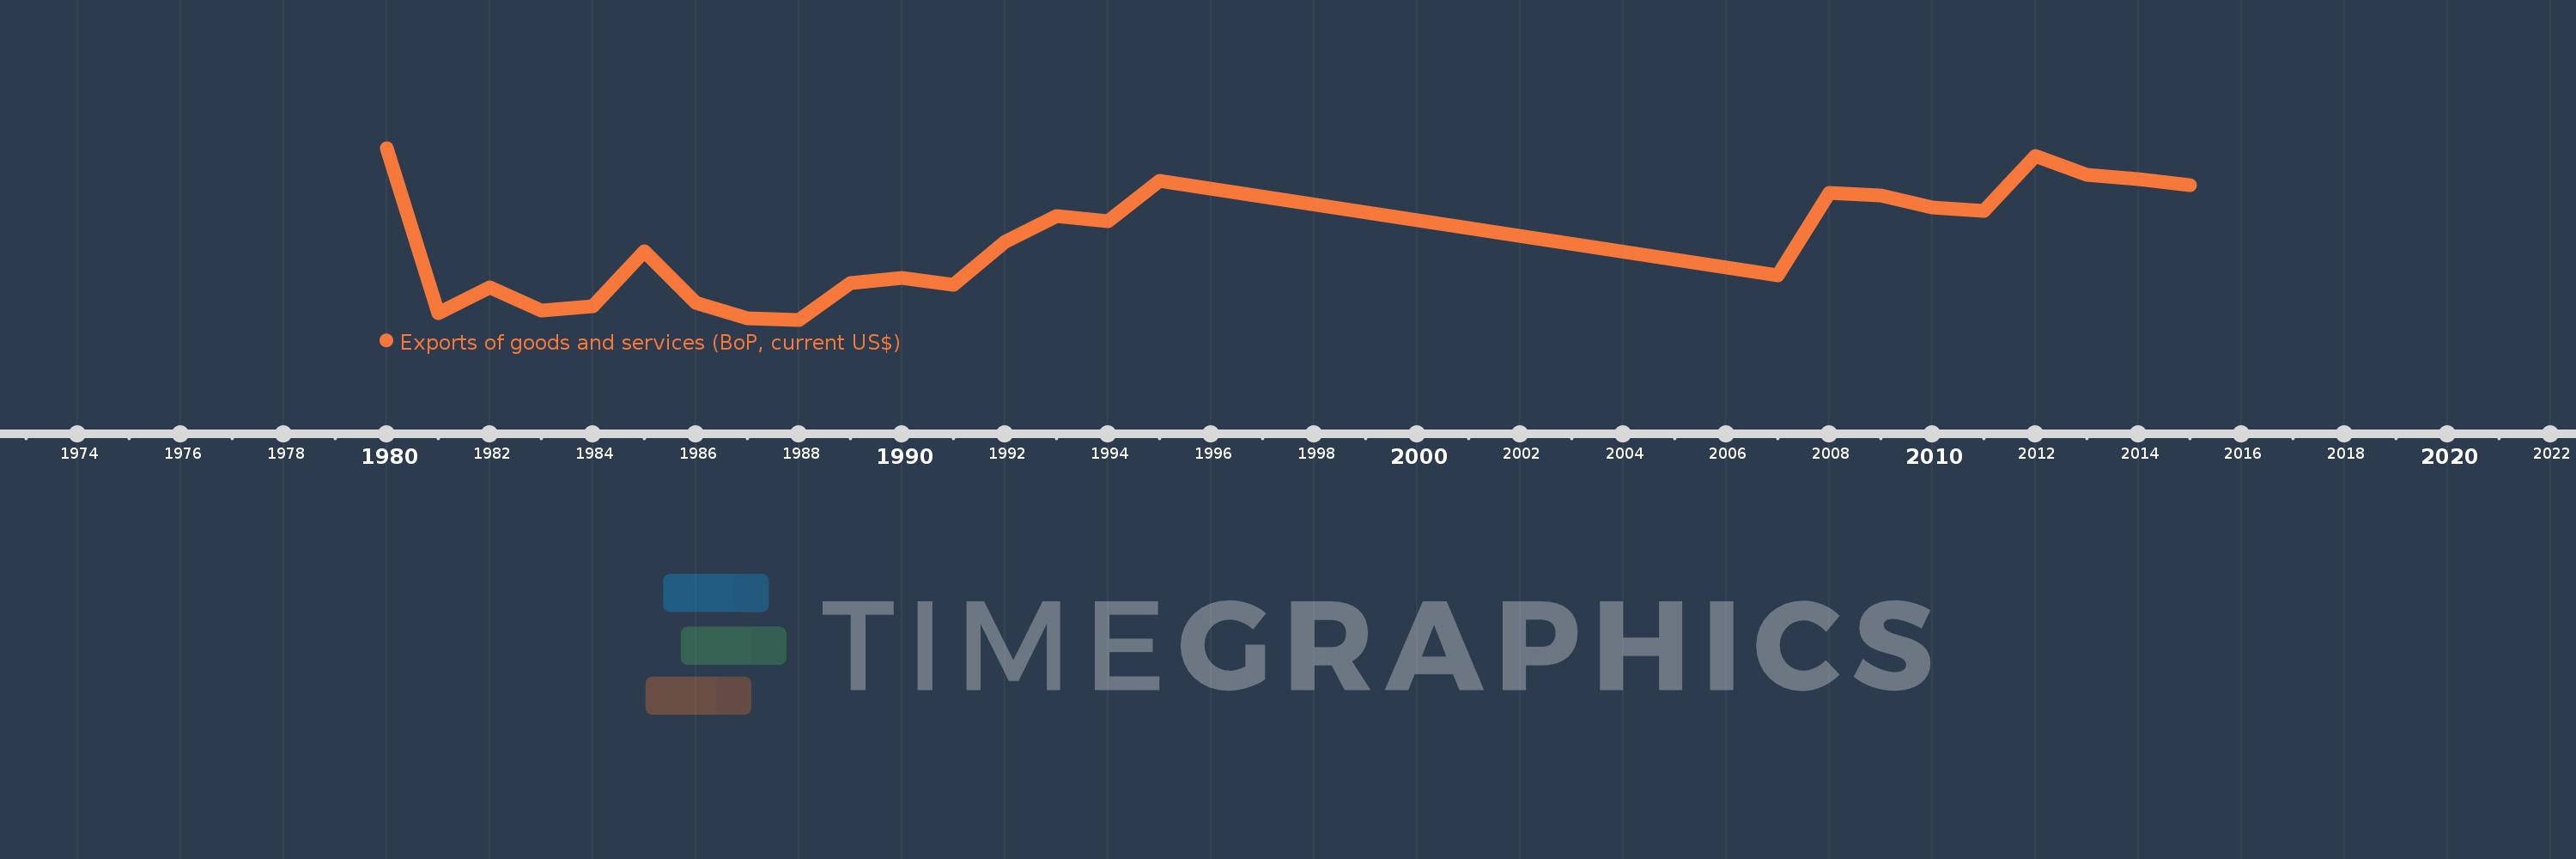
Exports of goods and services (BoP, current US$)
2015,2014,2013,2012,2011,2010,2009,2008,2007,1995,1994,1993,1992,1991,1990,1989,1988,1987,1986,1985,1984,1983,1982,1981,1980
This statistics in other country:
AfghanistanAlbaniaAlgeriaAngolaAntigua and BarbudaArab WorldArgentinaArmeniaArubaAustraliaAustriaAzerbaijanBahamas, TheBahrainBangladeshBarbadosBelarusBelgiumBelizeBeninBermudaBhutanBoliviaBosnia and HerzegovinaBotswanaBrazilBrunei DarussalamBulgariaBurkina FasoBurundiCabo VerdeCambodiaCameroonCanadaCaribbean small statesCentral African RepublicCentral Europe and the BalticsChadChileChinaColombiaComorosCongo, Dem. Rep.Congo, Rep.Costa RicaCote d'IvoireCroatiaCuracaoCyprusCzech RepublicDenmarkDjiboutiDominicaDominican RepublicEarly-demographic dividendEast Asia & PacificEast Asia & Pacific (excluding high income)East Asia & Pacific (IDA & IBRD countries)EcuadorEgypt, Arab Rep.El SalvadorEquatorial GuineaEritreaEstoniaEthiopiaEuro areaEurope & Central AsiaEurope & Central Asia (excluding high income)Europe & Central Asia (IDA & IBRD countries)European UnionFaroe IslandsFijiFinlandFragile and conflict affected situationsFranceFrench PolynesiaGabonGambia, TheGeorgiaGermanyGhanaGreeceGrenadaGuatemalaGuineaGuinea-BissauGuyanaHaitiHeavily indebted poor countries (HIPC)High incomeHondurasHong Kong SAR, ChinaHungaryIBRD onlyIcelandIDA & IBRD totalIDA blendIDA onlyIDA totalIndiaIndonesiaIran, Islamic Rep.IraqIrelandIsraelItalyJamaicaJapanJordanKazakhstanKenyaKiribatiKorea, Rep.KosovoKuwaitKyrgyz RepublicLao PDRLate-demographic dividendLatin America & Caribbean Latin America & Caribbean (excluding high income)Latin America & the Caribbean (IDA & IBRD countries)LatviaLeast developed countries: UN classificationLebanonLesothoLiberiaLibyaLithuaniaLow & middle incomeLow incomeLower middle incomeLuxembourgMacao SAR, ChinaMacedonia, FYRMadagascarMalawiMalaysiaMaldivesMaliMaltaMarshall IslandsMauritaniaMauritiusMexicoMicronesia, Fed. Sts.Middle East & North Africa (excluding high income)Middle East & North Africa (IDA & IBRD countries)Middle incomeMoldovaMongoliaMontenegroMoroccoMozambiqueMyanmarNamibiaNepalNetherlandsNew CaledoniaNicaraguaNigerNigeriaNorth AmericaNorwayOECD membersOmanPacific island small statesPakistanPalauPanamaPapua New GuineaParaguayPeruPhilippinesPolandPortugalPost-demographic dividendPre-demographic dividendQatarRomaniaRussian FederationRwandaSamoaSao Tome and PrincipeSaudi ArabiaSenegalSerbiaSeychellesSierra LeoneSingaporeSint Maarten (Dutch part)Slovak RepublicSloveniaSolomon IslandsSouth AfricaSouth AsiaSouth Asia (IDA & IBRD)South SudanSpainSri LankaSt. Kitts and NevisSt. LuciaSt. Vincent and the GrenadinesSub-Saharan Africa Sub-Saharan Africa (excluding high income)Sub-Saharan Africa (IDA & IBRD countries)SudanSurinameSwazilandSwedenSwitzerlandSyrian Arab RepublicTajikistanTanzaniaThailandTimor-LesteTogoTongaTrinidad and TobagoTunisiaTurkeyTuvaluUgandaUkraineUnited KingdomUnited StatesUpper middle incomeUruguayVanuatuVenezuela, RBVietnamWest Bank and GazaWorldYemen, Rep.ZambiaZimbabwe Timeline:
This timeline shows a graph from 1980 to 2015 of Kiribati. No data until 1979. Number of actual observations by date: 25.
Source name:
World Development Indicators
Source organization:
International Monetary Fund, Balance of Payments Statistics Yearbook and data files.
Categories, topics:
Economy & Growth, Trade
Last updated:
apr 23, 2017
Indicators value changes by year
Minimum:
6.923 mln
jan 1, 1988
Maximum:
27.63 mln
jan 1, 1980
At the date of observation
Value
Absolute change
Change from previous value
jan 1, 1980
27.63 mln
+27.63 mln
0.0%
jan 1, 1981
7.738 mln
-19.892 mln
-71.99%
jan 1, 1982
10.792 mln
+3.053 mln
39.46%
jan 1, 1983
8.062 mln
-2.73 mln
-25.29%
jan 1, 1984
8.563 mln
+500.974K
6.21%
jan 1, 1985
15.141 mln
+6.578 mln
76.82%
jan 1, 1986
8.999 mln
-6.141 mln
-40.56%
jan 1, 1987
7.058 mln
-1.941 mln
-21.57%
jan 1, 1988
6.923 mln
-134.78K
-1.91%
jan 1, 1989
11.336 mln
+4.412 mln
63.73%
jan 1, 1990
11.919 mln
+583.247K
5.15%
jan 1, 1991
11.088 mln
-831.493K
-6.98%
jan 1, 1992
16.278 mln
+5.19 mln
46.81%
jan 1, 1993
19.388 mln
+3.11 mln
19.1%
jan 1, 1994
18.82 mln
-567.49K
-2.93%
jan 1, 1995
23.708 mln
+4.887 mln
25.97%
jan 1, 2007
12.296 mln
-11.412 mln
-48.14%
jan 1, 2008
22.195 mln
+9.899 mln
80.51%
jan 1, 2009
21.88 mln
-314.779K
-1.42%
jan 1, 2010
20.463 mln
-1.416 mln
-6.47%
jan 1, 2011
20.058 mln
-405.45K
-1.98%
jan 1, 2012
26.672 mln
+6.614 mln
32.97%
jan 1, 2013
24.427 mln
-2.245 mln
-8.42%
jan 1, 2014
23.881 mln
-545.694K
-2.23%
jan 1, 2015
23.106 mln
-775.097K
-3.25%
Ranking of countries by current statistics by years


Comments: