29
/
en
AIzaSyAYiBZKx7MnpbEhh9jyipgxe19OcubqV5w
April 1, 2024
249824
St. Kitts and Nevis
KNA
true
2
1
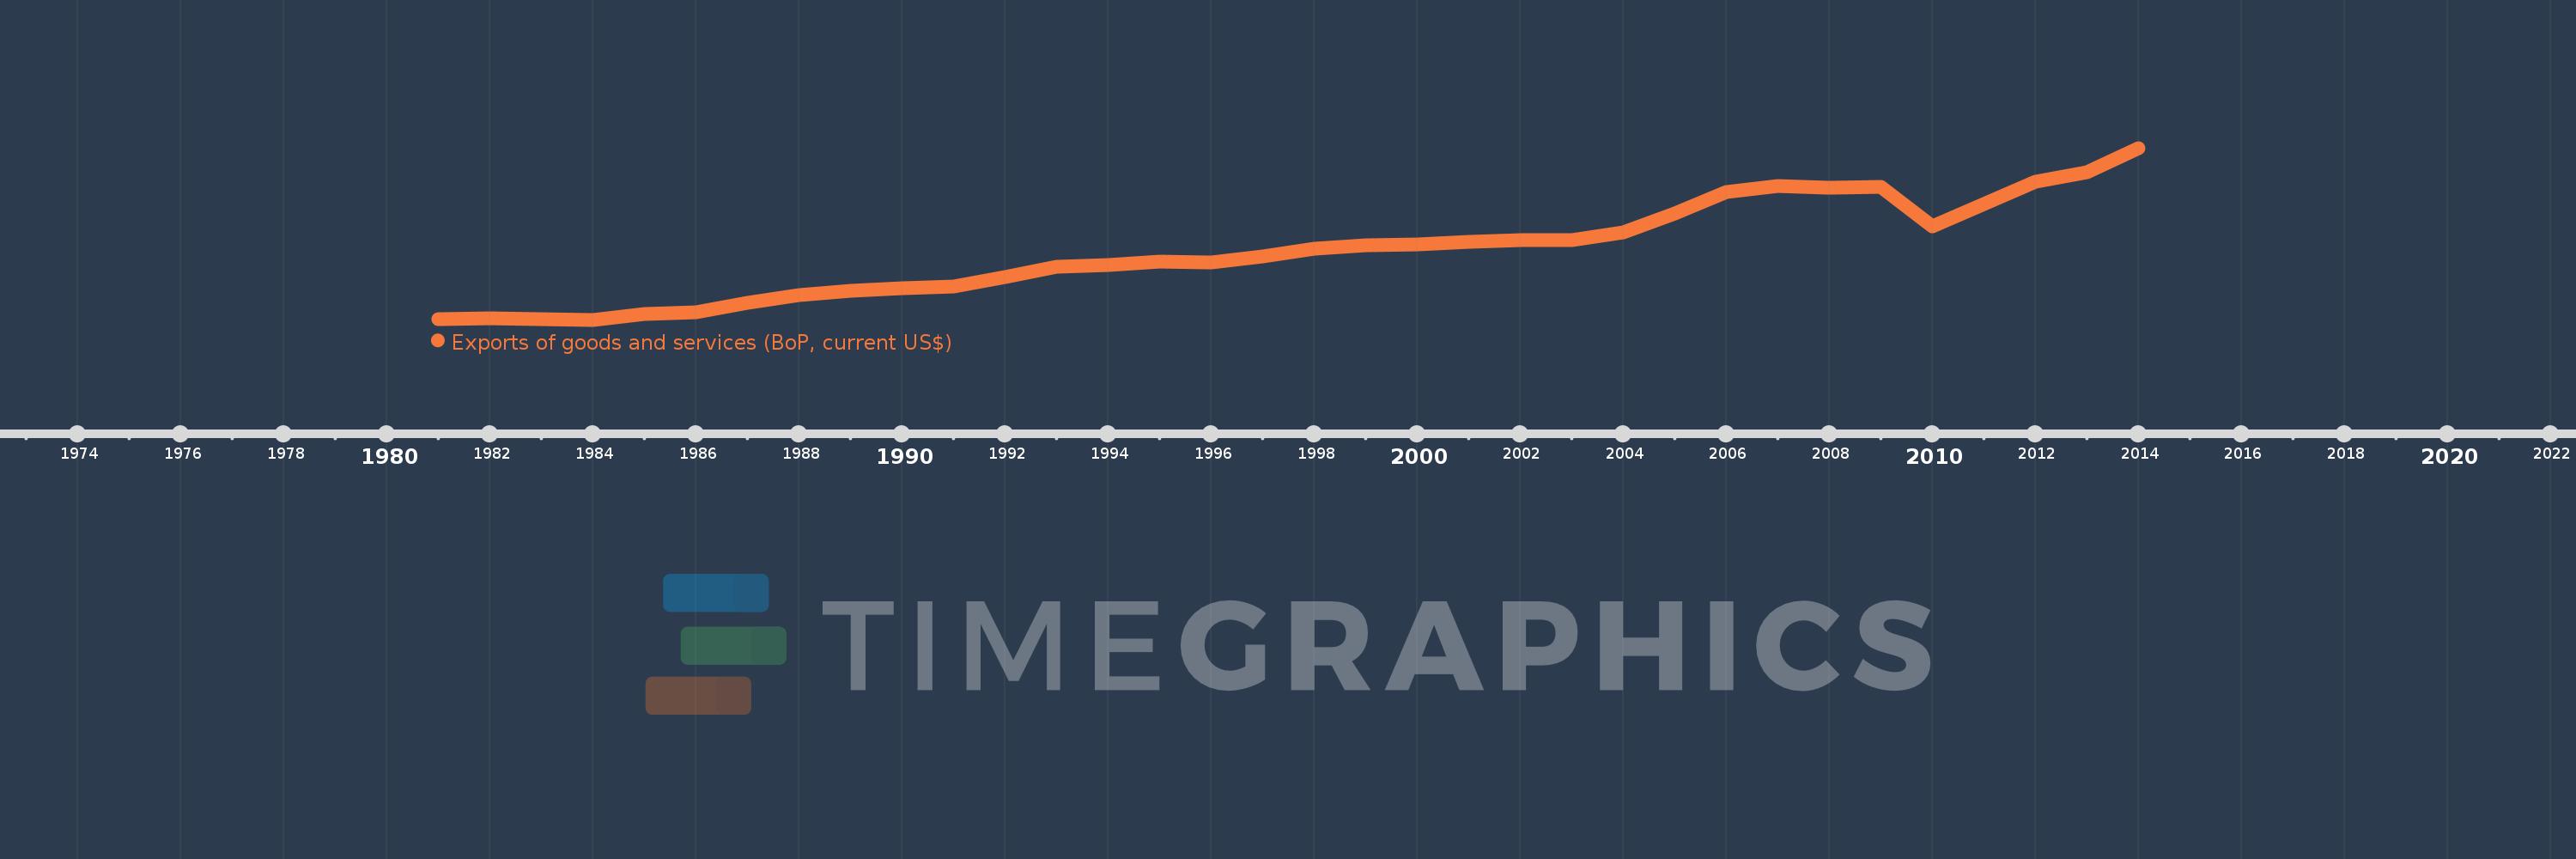
Exports of goods and services (BoP, current US$)
2014,2013,2012,2011,2010,2009,2008,2007,2006,2005,2004,2003,2002,2001,2000,1999,1998,1997,1996,1995,1994,1993,1992,1991,1990,1989,1988,1987,1986,1985,1984,1983,1982,1981
This statistics in other country:
AfghanistanAlbaniaAlgeriaAngolaAntigua and BarbudaArab WorldArgentinaArmeniaArubaAustraliaAustriaAzerbaijanBahamas, TheBahrainBangladeshBarbadosBelarusBelgiumBelizeBeninBermudaBhutanBoliviaBosnia and HerzegovinaBotswanaBrazilBrunei DarussalamBulgariaBurkina FasoBurundiCabo VerdeCambodiaCameroonCanadaCaribbean small statesCentral African RepublicCentral Europe and the BalticsChadChileChinaColombiaComorosCongo, Dem. Rep.Congo, Rep.Costa RicaCote d'IvoireCroatiaCuracaoCyprusCzech RepublicDenmarkDjiboutiDominicaDominican RepublicEarly-demographic dividendEast Asia & PacificEast Asia & Pacific (excluding high income)East Asia & Pacific (IDA & IBRD countries)EcuadorEgypt, Arab Rep.El SalvadorEquatorial GuineaEritreaEstoniaEthiopiaEuro areaEurope & Central AsiaEurope & Central Asia (excluding high income)Europe & Central Asia (IDA & IBRD countries)European UnionFaroe IslandsFijiFinlandFragile and conflict affected situationsFranceFrench PolynesiaGabonGambia, TheGeorgiaGermanyGhanaGreeceGrenadaGuatemalaGuineaGuinea-BissauGuyanaHaitiHeavily indebted poor countries (HIPC)High incomeHondurasHong Kong SAR, ChinaHungaryIBRD onlyIcelandIDA & IBRD totalIDA blendIDA onlyIDA totalIndiaIndonesiaIran, Islamic Rep.IraqIrelandIsraelItalyJamaicaJapanJordanKazakhstanKenyaKiribatiKorea, Rep.KosovoKuwaitKyrgyz RepublicLao PDRLate-demographic dividendLatin America & Caribbean Latin America & Caribbean (excluding high income)Latin America & the Caribbean (IDA & IBRD countries)LatviaLeast developed countries: UN classificationLebanonLesothoLiberiaLibyaLithuaniaLow & middle incomeLow incomeLower middle incomeLuxembourgMacao SAR, ChinaMacedonia, FYRMadagascarMalawiMalaysiaMaldivesMaliMaltaMarshall IslandsMauritaniaMauritiusMexicoMicronesia, Fed. Sts.Middle East & North Africa (excluding high income)Middle East & North Africa (IDA & IBRD countries)Middle incomeMoldovaMongoliaMontenegroMoroccoMozambiqueMyanmarNamibiaNepalNetherlandsNew CaledoniaNicaraguaNigerNigeriaNorth AmericaNorwayOECD membersOmanPacific island small statesPakistanPalauPanamaPapua New GuineaParaguayPeruPhilippinesPolandPortugalPost-demographic dividendPre-demographic dividendQatarRomaniaRussian FederationRwandaSamoaSao Tome and PrincipeSaudi ArabiaSenegalSerbiaSeychellesSierra LeoneSingaporeSint Maarten (Dutch part)Slovak RepublicSloveniaSolomon IslandsSouth AfricaSouth AsiaSouth Asia (IDA & IBRD)South SudanSpainSri LankaSt. Kitts and NevisSt. LuciaSt. Vincent and the GrenadinesSub-Saharan Africa Sub-Saharan Africa (excluding high income)Sub-Saharan Africa (IDA & IBRD countries)SudanSurinameSwazilandSwedenSwitzerlandSyrian Arab RepublicTajikistanTanzaniaThailandTimor-LesteTogoTongaTrinidad and TobagoTunisiaTurkeyTuvaluUgandaUkraineUnited KingdomUnited StatesUpper middle incomeUruguayVanuatuVenezuela, RBVietnamWest Bank and GazaWorldYemen, Rep.ZambiaZimbabwe Timeline:
This timeline shows a graph from 1981 to 2014 of St. Kitts and Nevis. No data until 1980. Number of actual observations by date: 34.
Source name:
World Development Indicators
Source organization:
International Monetary Fund, Balance of Payments Statistics Yearbook and data files.
Categories, topics:
Economy & Growth, Trade
Last updated:
apr 23, 2017
Indicators value changes by year
Minimum:
31.426 mln
jan 1, 1984
Maximum:
294.223 mln
jan 1, 2014
At the date of observation
Value
Absolute change
Change from previous value
jan 1, 1981
32.222 mln
+32.222 mln
0.0%
jan 1, 1982
34.263 mln
+2.041 mln
6.33%
jan 1, 1983
32.037 mln
-2.226 mln
-6.5%
jan 1, 1984
31.426 mln
-611.111K
-1.91%
jan 1, 1985
40.467 mln
+9.041 mln
28.77%
jan 1, 1986
43.174 mln
+2.707 mln
6.69%
jan 1, 1987
57.844 mln
+14.67 mln
33.98%
jan 1, 1988
69.13 mln
+11.285 mln
19.51%
jan 1, 1989
75.159 mln
+6.03 mln
8.72%
jan 1, 1990
79.207 mln
+4.048 mln
5.39%
jan 1, 1991
82.385 mln
+3.178 mln
4.01%
jan 1, 1992
96.963 mln
+14.578 mln
17.69%
jan 1, 1993
112.796 mln
+15.833 mln
16.33%
jan 1, 1994
115.415 mln
+2.619 mln
2.32%
jan 1, 1995
120.948 mln
+5.533 mln
4.79%
jan 1, 1996
118.507 mln
-2.441 mln
-2.02%
jan 1, 1997
127.619 mln
+9.111 mln
7.69%
jan 1, 1998
140.241 mln
+12.622 mln
9.89%
jan 1, 1999
144.981 mln
+4.741 mln
3.38%
jan 1, 2000
146.019 mln
+1.037 mln
0.72%
jan 1, 2001
149.989 mln
+3.97 mln
2.72%
jan 1, 2002
152.911 mln
+2.922 mln
1.95%
jan 1, 2003
153.306 mln
+394.885K
0.26%
jan 1, 2004
165.181 mln
+11.875 mln
7.75%
jan 1, 2005
193.95 mln
+28.769 mln
17.42%
jan 1, 2006
226.658 mln
+32.709 mln
16.86%
jan 1, 2007
235.709 mln
+9.051 mln
3.99%
jan 1, 2008
233.02 mln
-2.688 mln
-1.14%
jan 1, 2009
234.687 mln
+1.667 mln
0.72%
jan 1, 2010
174.776 mln
-59.912 mln
-25.53%
jan 1, 2011
208.13 mln
+33.355 mln
19.08%
jan 1, 2012
242.554 mln
+34.424 mln
16.54%
jan 1, 2013
257.246 mln
+14.692 mln
6.06%
jan 1, 2014
294.223 mln
+36.977 mln
14.37%
Ranking of countries by current statistics by years


Comments: