29
/
en
AIzaSyAYiBZKx7MnpbEhh9jyipgxe19OcubqV5w
April 1, 2024
91071
Brazil
BRA
true
2
1
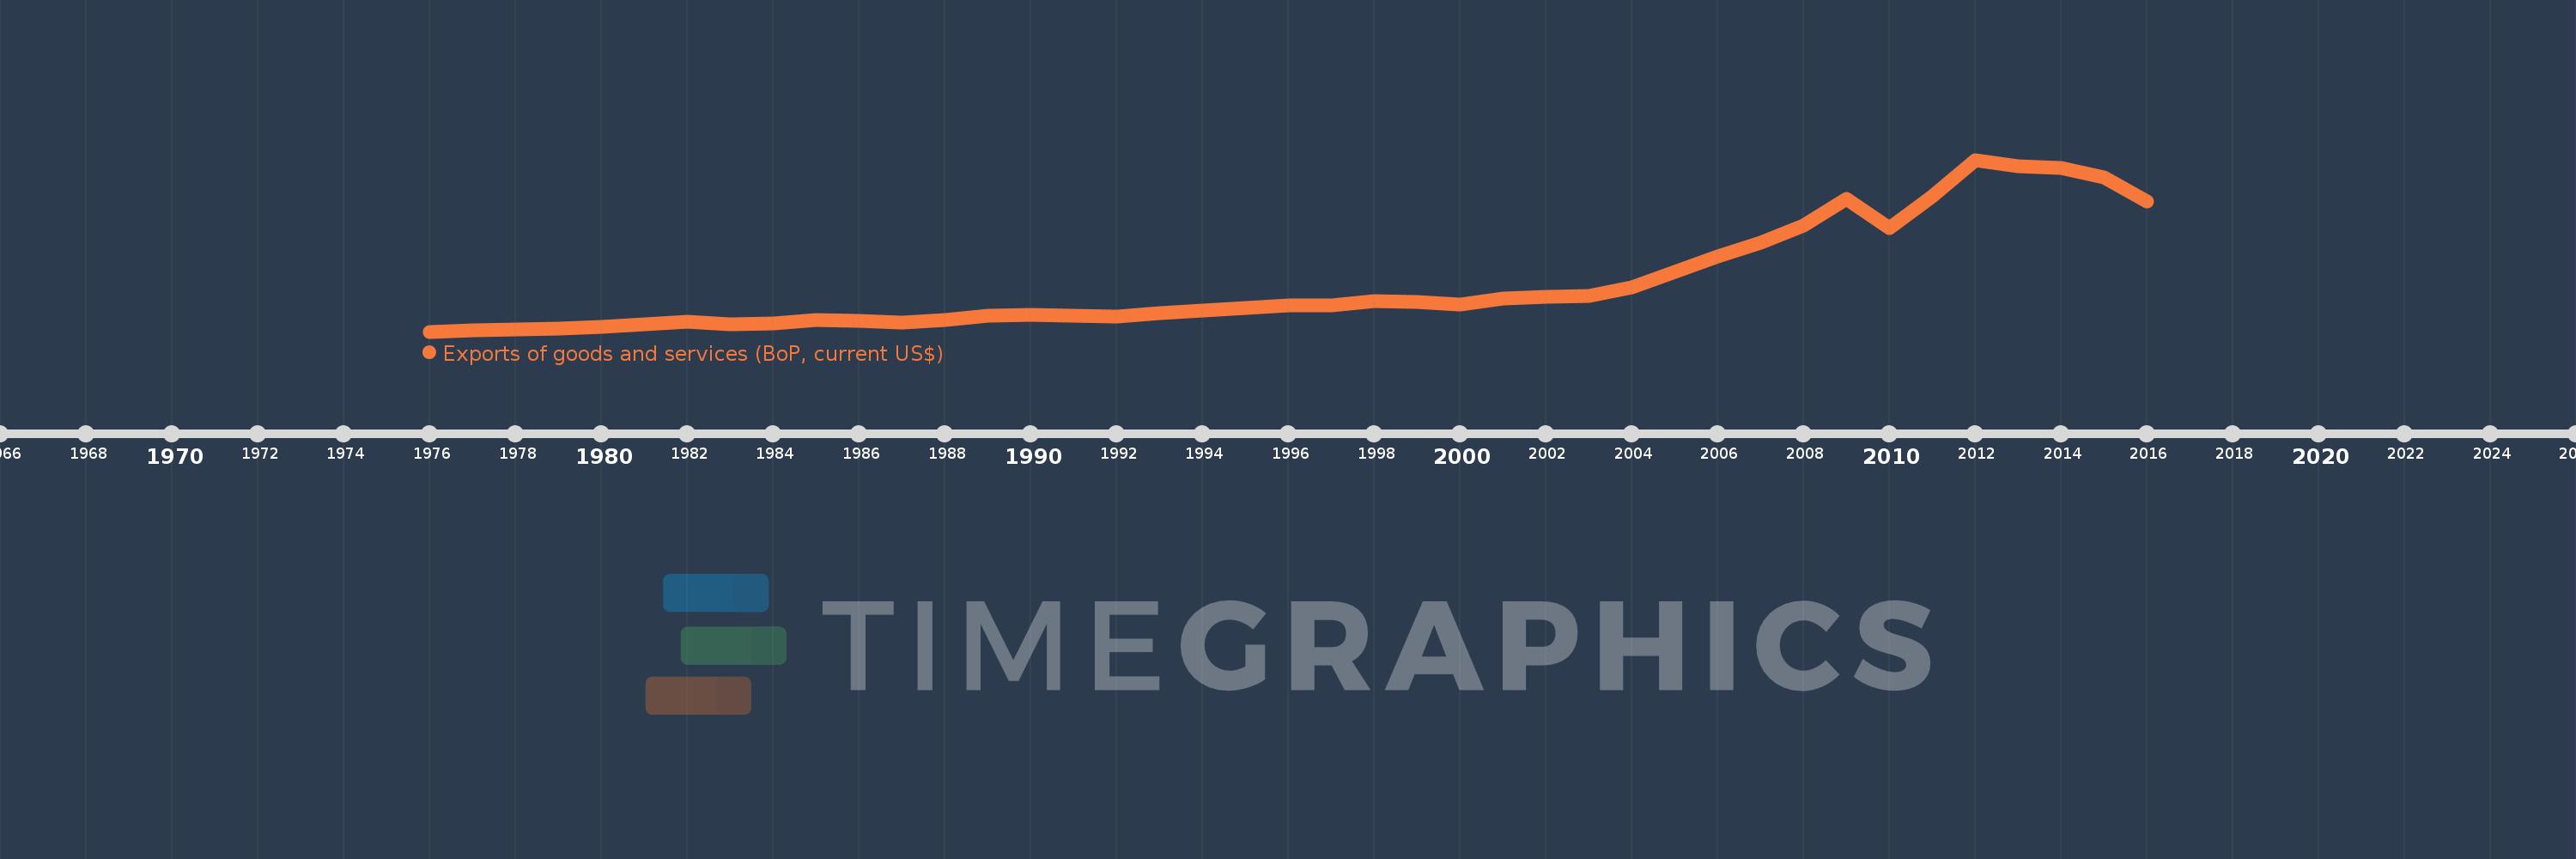
Exports of goods and services (BoP, current US$)
2016,2015,2014,2013,2012,2011,2010,2009,2008,2007,2006,2005,2004,2003,2002,2001,2000,1999,1998,1997,1996,1995,1994,1993,1992,1991,1990,1989,1988,1987,1986,1985,1984,1983,1982,1981,1980,1979,1978,1977,1976
This statistics in other country:
AfghanistanAlbaniaAlgeriaAngolaAntigua and BarbudaArab WorldArgentinaArmeniaArubaAustraliaAustriaAzerbaijanBahamas, TheBahrainBangladeshBarbadosBelarusBelgiumBelizeBeninBermudaBhutanBoliviaBosnia and HerzegovinaBotswanaBrazilBrunei DarussalamBulgariaBurkina FasoBurundiCabo VerdeCambodiaCameroonCanadaCaribbean small statesCentral African RepublicCentral Europe and the BalticsChadChileChinaColombiaComorosCongo, Dem. Rep.Congo, Rep.Costa RicaCote d'IvoireCroatiaCuracaoCyprusCzech RepublicDenmarkDjiboutiDominicaDominican RepublicEarly-demographic dividendEast Asia & PacificEast Asia & Pacific (excluding high income)East Asia & Pacific (IDA & IBRD countries)EcuadorEgypt, Arab Rep.El SalvadorEquatorial GuineaEritreaEstoniaEthiopiaEuro areaEurope & Central AsiaEurope & Central Asia (excluding high income)Europe & Central Asia (IDA & IBRD countries)European UnionFaroe IslandsFijiFinlandFragile and conflict affected situationsFranceFrench PolynesiaGabonGambia, TheGeorgiaGermanyGhanaGreeceGrenadaGuatemalaGuineaGuinea-BissauGuyanaHaitiHeavily indebted poor countries (HIPC)High incomeHondurasHong Kong SAR, ChinaHungaryIBRD onlyIcelandIDA & IBRD totalIDA blendIDA onlyIDA totalIndiaIndonesiaIran, Islamic Rep.IraqIrelandIsraelItalyJamaicaJapanJordanKazakhstanKenyaKiribatiKorea, Rep.KosovoKuwaitKyrgyz RepublicLao PDRLate-demographic dividendLatin America & Caribbean Latin America & Caribbean (excluding high income)Latin America & the Caribbean (IDA & IBRD countries)LatviaLeast developed countries: UN classificationLebanonLesothoLiberiaLibyaLithuaniaLow & middle incomeLow incomeLower middle incomeLuxembourgMacao SAR, ChinaMacedonia, FYRMadagascarMalawiMalaysiaMaldivesMaliMaltaMarshall IslandsMauritaniaMauritiusMexicoMicronesia, Fed. Sts.Middle East & North Africa (excluding high income)Middle East & North Africa (IDA & IBRD countries)Middle incomeMoldovaMongoliaMontenegroMoroccoMozambiqueMyanmarNamibiaNepalNetherlandsNew CaledoniaNicaraguaNigerNigeriaNorth AmericaNorwayOECD membersOmanPacific island small statesPakistanPalauPanamaPapua New GuineaParaguayPeruPhilippinesPolandPortugalPost-demographic dividendPre-demographic dividendQatarRomaniaRussian FederationRwandaSamoaSao Tome and PrincipeSaudi ArabiaSenegalSerbiaSeychellesSierra LeoneSingaporeSint Maarten (Dutch part)Slovak RepublicSloveniaSolomon IslandsSouth AfricaSouth AsiaSouth Asia (IDA & IBRD)South SudanSpainSri LankaSt. Kitts and NevisSt. LuciaSt. Vincent and the GrenadinesSub-Saharan Africa Sub-Saharan Africa (excluding high income)Sub-Saharan Africa (IDA & IBRD countries)SudanSurinameSwazilandSwedenSwitzerlandSyrian Arab RepublicTajikistanTanzaniaThailandTimor-LesteTogoTongaTrinidad and TobagoTunisiaTurkeyTuvaluUgandaUkraineUnited KingdomUnited StatesUpper middle incomeUruguayVanuatuVenezuela, RBVietnamWest Bank and GazaWorldYemen, Rep.ZambiaZimbabwe Timeline:
This timeline shows a graph from 1976 to 2016 of Brazil. No data until 1975. Number of actual observations by date: 41.
Source name:
World Development Indicators
Source organization:
International Monetary Fund, Balance of Payments Statistics Yearbook and data files.
Categories, topics:
Economy & Growth, Trade
Last updated:
apr 23, 2017
Indicators value changes by year
Minimum:
9.552 bln
jan 1, 1976
Maximum:
292.55 bln
jan 1, 2012
At the date of observation
Value
Absolute change
Change from previous value
jan 1, 1976
9.552 bln
+9.552 bln
0.0%
jan 1, 1977
10.979 bln
+1.427 bln
14.94%
jan 1, 1978
13.13 bln
+2.151 bln
19.59%
jan 1, 1979
13.823 bln
+693.0 mln
5.28%
jan 1, 1980
16.719 bln
+2.896 bln
20.95%
jan 1, 1981
21.869 bln
+5.15 bln
30.8%
jan 1, 1982
25.541 bln
+3.672 bln
16.79%
jan 1, 1983
21.982 bln
-3.559 bln
-13.93%
jan 1, 1984
23.622 bln
+1.64 bln
7.46%
jan 1, 1985
28.949 bln
+5.327 bln
22.55%
jan 1, 1986
27.72 bln
-1.229 bln
-4.25%
jan 1, 1987
24.164 bln
-3.556 bln
-12.83%
jan 1, 1988
28.162 bln
+3.998 bln
16.55%
jan 1, 1989
36.052 bln
+7.89 bln
28.02%
jan 1, 1990
37.507 bln
+1.455 bln
4.04%
jan 1, 1991
35.17 bln
-2.337 bln
-6.23%
jan 1, 1992
34.938 bln
-232.0 mln
-0.66%
jan 1, 1993
39.881 bln
+4.943 bln
14.15%
jan 1, 1994
43.595 bln
+3.714 bln
9.31%
jan 1, 1995
49.01 bln
+5.415 bln
12.42%
jan 1, 1996
52.641 bln
+3.631 bln
7.41%
jan 1, 1997
52.506 bln
-135.0 mln
-0.26%
jan 1, 1998
59.178 bln
+6.672 bln
12.71%
jan 1, 1999
58.767 bln
-411.0 mln
-0.69%
jan 1, 2000
54.563 bln
-4.204 bln
-7.15%
jan 1, 2001
63.717 bln
+9.154 bln
16.78%
jan 1, 2002
66.517 bln
+2.8 bln
4.4%
jan 1, 2003
68.943 bln
+2.426 bln
3.65%
jan 1, 2004
82.57 bln
+13.627 bln
19.77%
jan 1, 2005
107.985 bln
+25.415 bln
30.78%
jan 1, 2006
133.005 bln
+25.02 bln
23.17%
jan 1, 2007
156.303 bln
+23.298 bln
17.52%
jan 1, 2008
184.603 bln
+28.3 bln
18.11%
jan 1, 2009
228.393 bln
+43.79 bln
23.72%
jan 1, 2010
180.723 bln
-47.67 bln
-20.87%
jan 1, 2011
232.06 bln
+51.337 bln
28.41%
jan 1, 2012
292.55 bln
+60.49 bln
26.07%
jan 1, 2013
281.259 bln
-11.29 bln
-3.86%
jan 1, 2014
279.639 bln
-1.621 bln
-0.58%
jan 1, 2015
264.063 bln
-15.576 bln
-5.57%
jan 1, 2016
223.87 bln
-40.194 bln
-15.22%
Ranking of countries by current statistics by years


Comments: