29
/
en
AIzaSyAYiBZKx7MnpbEhh9jyipgxe19OcubqV5w
April 1, 2024
59731
Sub-Saharan Africa (excluding high income)
SSA
false
2
1
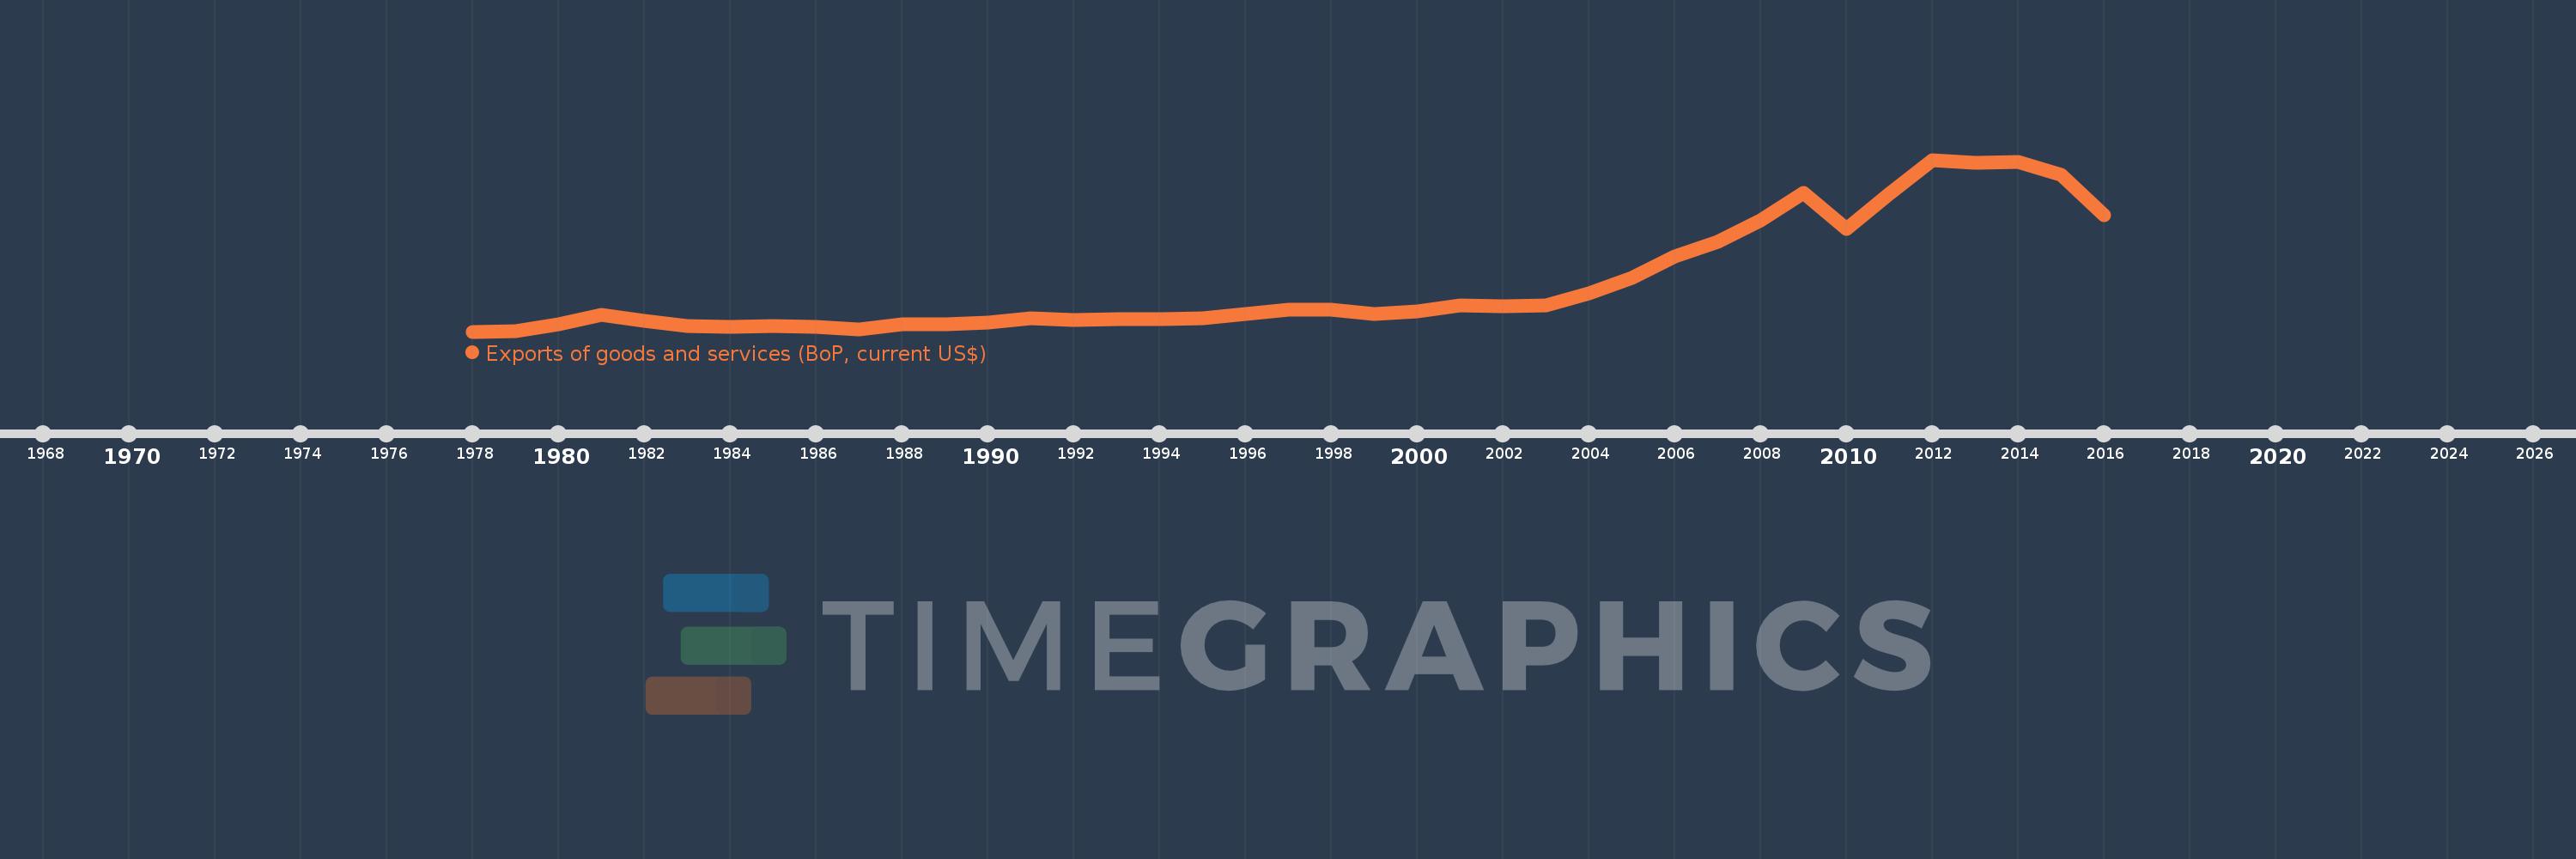
Exports of goods and services (BoP, current US$)
2016,2015,2014,2013,2012,2011,2010,2009,2008,2007,2006,2005,2004,2003,2002,2001,2000,1999,1998,1997,1996,1995,1994,1993,1992,1991,1990,1989,1988,1987,1986,1985,1984,1983,1982,1981,1980,1979,1978
This statistics in other country:
AfghanistanAlbaniaAlgeriaAngolaAntigua and BarbudaArab WorldArgentinaArmeniaArubaAustraliaAustriaAzerbaijanBahamas, TheBahrainBangladeshBarbadosBelarusBelgiumBelizeBeninBermudaBhutanBoliviaBosnia and HerzegovinaBotswanaBrazilBrunei DarussalamBulgariaBurkina FasoBurundiCabo VerdeCambodiaCameroonCanadaCaribbean small statesCentral African RepublicCentral Europe and the BalticsChadChileChinaColombiaComorosCongo, Dem. Rep.Congo, Rep.Costa RicaCote d'IvoireCroatiaCuracaoCyprusCzech RepublicDenmarkDjiboutiDominicaDominican RepublicEarly-demographic dividendEast Asia & PacificEast Asia & Pacific (excluding high income)East Asia & Pacific (IDA & IBRD countries)EcuadorEgypt, Arab Rep.El SalvadorEquatorial GuineaEritreaEstoniaEthiopiaEuro areaEurope & Central AsiaEurope & Central Asia (excluding high income)Europe & Central Asia (IDA & IBRD countries)European UnionFaroe IslandsFijiFinlandFragile and conflict affected situationsFranceFrench PolynesiaGabonGambia, TheGeorgiaGermanyGhanaGreeceGrenadaGuatemalaGuineaGuinea-BissauGuyanaHaitiHeavily indebted poor countries (HIPC)High incomeHondurasHong Kong SAR, ChinaHungaryIBRD onlyIcelandIDA & IBRD totalIDA blendIDA onlyIDA totalIndiaIndonesiaIran, Islamic Rep.IraqIrelandIsraelItalyJamaicaJapanJordanKazakhstanKenyaKiribatiKorea, Rep.KosovoKuwaitKyrgyz RepublicLao PDRLate-demographic dividendLatin America & Caribbean Latin America & Caribbean (excluding high income)Latin America & the Caribbean (IDA & IBRD countries)LatviaLeast developed countries: UN classificationLebanonLesothoLiberiaLibyaLithuaniaLow & middle incomeLow incomeLower middle incomeLuxembourgMacao SAR, ChinaMacedonia, FYRMadagascarMalawiMalaysiaMaldivesMaliMaltaMarshall IslandsMauritaniaMauritiusMexicoMicronesia, Fed. Sts.Middle East & North Africa (excluding high income)Middle East & North Africa (IDA & IBRD countries)Middle incomeMoldovaMongoliaMontenegroMoroccoMozambiqueMyanmarNamibiaNepalNetherlandsNew CaledoniaNicaraguaNigerNigeriaNorth AmericaNorwayOECD membersOmanPacific island small statesPakistanPalauPanamaPapua New GuineaParaguayPeruPhilippinesPolandPortugalPost-demographic dividendPre-demographic dividendQatarRomaniaRussian FederationRwandaSamoaSao Tome and PrincipeSaudi ArabiaSenegalSerbiaSeychellesSierra LeoneSingaporeSint Maarten (Dutch part)Slovak RepublicSloveniaSolomon IslandsSouth AfricaSouth AsiaSouth Asia (IDA & IBRD)South SudanSpainSri LankaSt. Kitts and NevisSt. LuciaSt. Vincent and the GrenadinesSub-Saharan Africa Sub-Saharan Africa (excluding high income)Sub-Saharan Africa (IDA & IBRD countries)SudanSurinameSwazilandSwedenSwitzerlandSyrian Arab RepublicTajikistanTanzaniaThailandTimor-LesteTogoTongaTrinidad and TobagoTunisiaTurkeyTuvaluUgandaUkraineUnited KingdomUnited StatesUpper middle incomeUruguayVanuatuVenezuela, RBVietnamWest Bank and GazaWorldYemen, Rep.ZambiaZimbabwe Timeline:
This timeline shows a graph from 1978 to 2016 of Sub-Saharan Africa (excluding high income). No data until 1977. Number of actual observations by date: 39.
Source name:
World Development Indicators
Source organization:
International Monetary Fund, Balance of Payments Statistics Yearbook and data files.
Categories, topics:
Economy & Growth, Trade
Last updated:
apr 23, 2017
Indicators value changes by year
Minimum:
45.656 bln
jan 1, 1978
Maximum:
506.607 bln
jan 1, 2012
At the date of observation
Value
Absolute change
Change from previous value
jan 1, 1978
45.656 bln
+45.656 bln
0.0%
jan 1, 1979
47.542 bln
+1.887 bln
4.13%
jan 1, 1980
65.59 bln
+18.048 bln
37.96%
jan 1, 1981
91.633 bln
+26.042 bln
39.7%
jan 1, 1982
74.416 bln
-17.217 bln
-18.79%
jan 1, 1983
60.601 bln
-13.815 bln
-18.56%
jan 1, 1984
58.648 bln
-1.953 bln
-3.22%
jan 1, 1985
59.54 bln
+892.224 mln
1.52%
jan 1, 1986
59.051 bln
-488.651 mln
-0.82%
jan 1, 1987
51.588 bln
-7.463 bln
-12.64%
jan 1, 1988
64.119 bln
+12.531 bln
24.29%
jan 1, 1989
66.016 bln
+1.897 bln
2.96%
jan 1, 1990
68.907 bln
+2.89 bln
4.38%
jan 1, 1991
81.445 bln
+12.538 bln
18.2%
jan 1, 1992
77.479 bln
-3.966 bln
-4.87%
jan 1, 1993
79.336 bln
+1.858 bln
2.4%
jan 1, 1994
79.291 bln
-45.721 mln
-0.06%
jan 1, 1995
81.263 bln
+1.972 bln
2.49%
jan 1, 1996
93.63 bln
+12.367 bln
15.22%
jan 1, 1997
105.098 bln
+11.468 bln
12.25%
jan 1, 1998
105.534 bln
+436.321 mln
0.42%
jan 1, 1999
92.505 bln
-13.029 bln
-12.35%
jan 1, 2000
99.395 bln
+6.89 bln
7.45%
jan 1, 2001
117.064 bln
+17.669 bln
17.78%
jan 1, 2002
112.826 bln
-4.238 bln
-3.62%
jan 1, 2003
116.698 bln
+3.872 bln
3.43%
jan 1, 2004
148.779 bln
+32.081 bln
27.49%
jan 1, 2005
189.923 bln
+41.144 bln
27.65%
jan 1, 2006
246.974 bln
+57.051 bln
30.04%
jan 1, 2007
285.936 bln
+38.962 bln
15.78%
jan 1, 2008
343.409 bln
+57.473 bln
20.1%
jan 1, 2009
418.633 bln
+75.225 bln
21.91%
jan 1, 2010
321.6 bln
-97.033 bln
-23.18%
jan 1, 2011
415.162 bln
+93.562 bln
29.09%
jan 1, 2012
506.607 bln
+91.444 bln
22.03%
jan 1, 2013
497.629 bln
-8.978 bln
-1.77%
jan 1, 2014
500.941 bln
+3.312 bln
0.67%
jan 1, 2015
466.924 bln
-34.017 bln
-6.79%
jan 1, 2016
358.041 bln
-108.883 bln
-23.32%
Ranking of countries by current statistics by years


Comments: