29
/
en
AIzaSyAYiBZKx7MnpbEhh9jyipgxe19OcubqV5w
April 1, 2024
43382
Latin America & the Caribbean (IDA & IBRD countries)
TLA
false
2
1
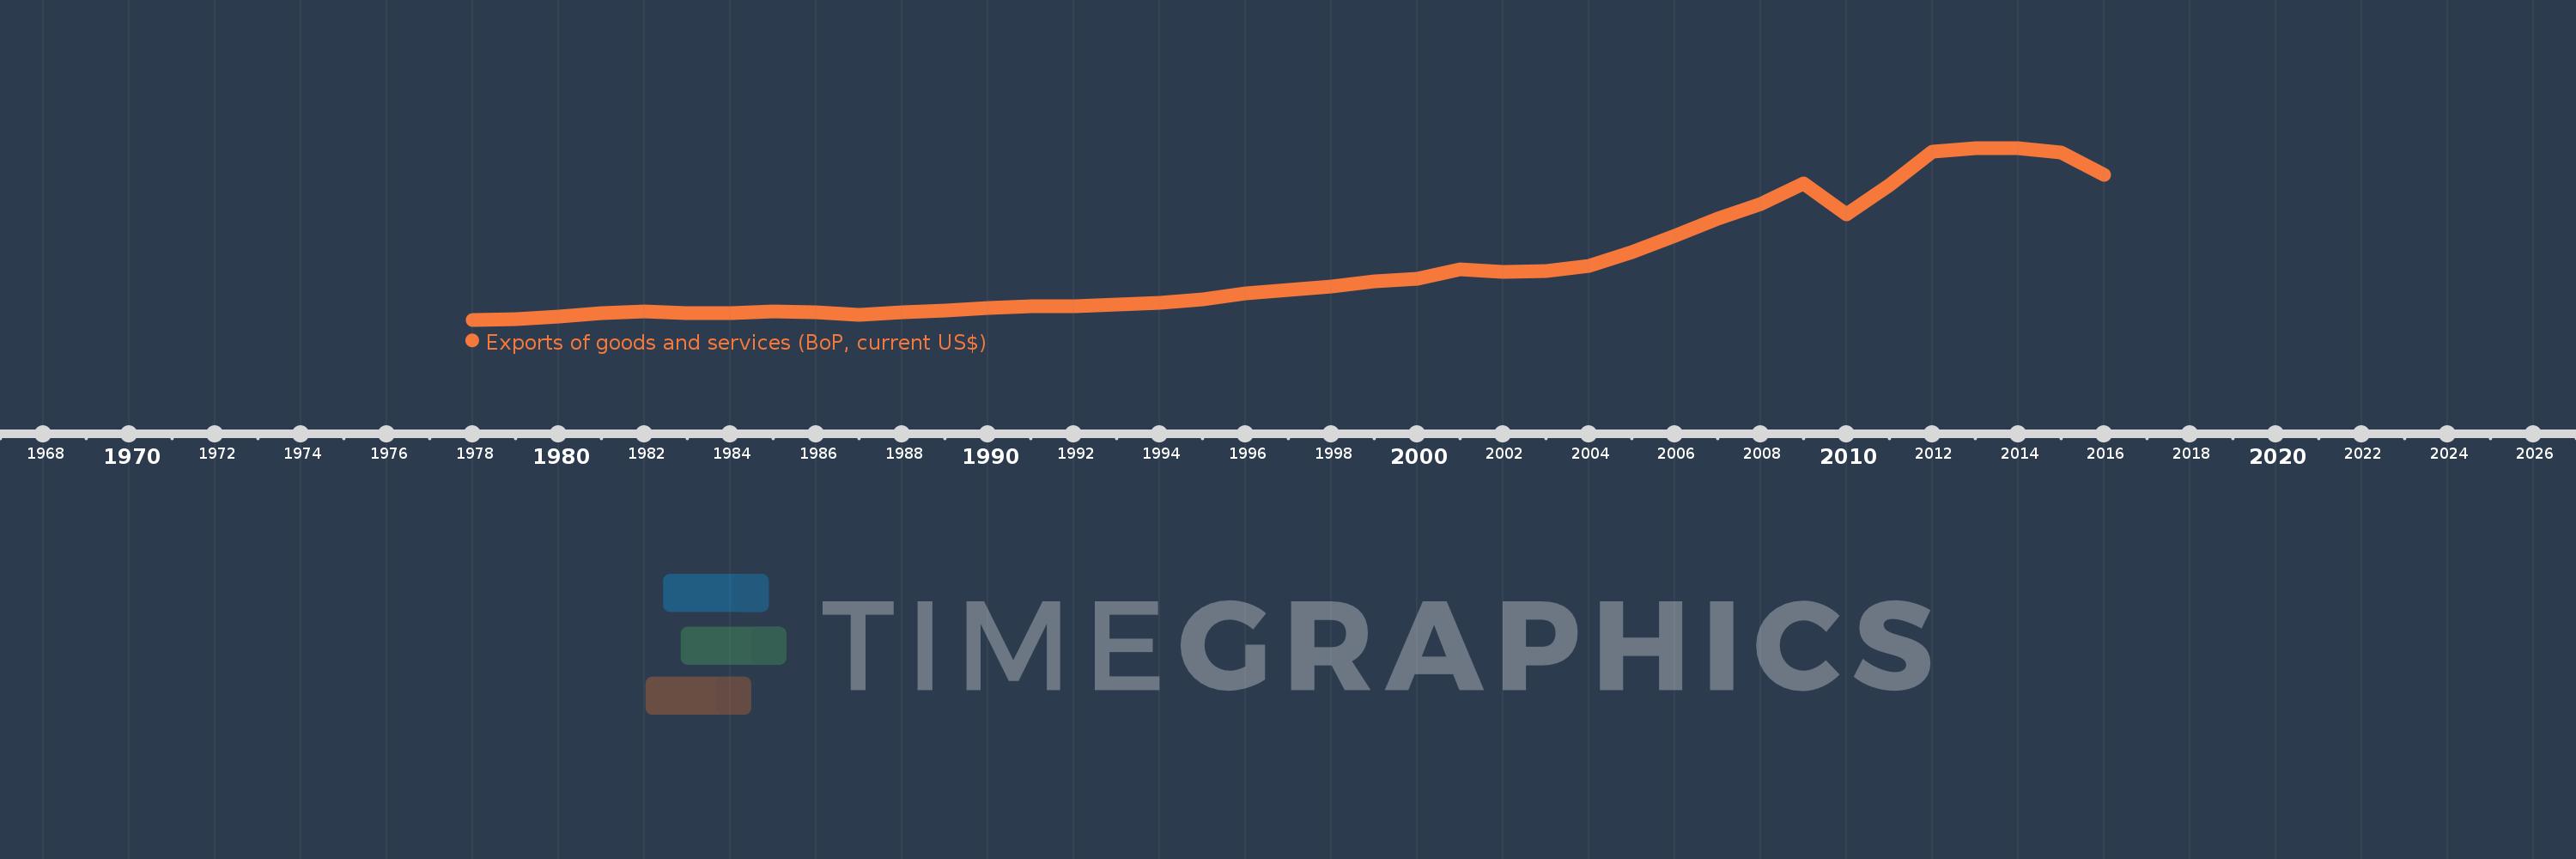
Exports of goods and services (BoP, current US$)
2016,2015,2014,2013,2012,2011,2010,2009,2008,2007,2006,2005,2004,2003,2002,2001,2000,1999,1998,1997,1996,1995,1994,1993,1992,1991,1990,1989,1988,1987,1986,1985,1984,1983,1982,1981,1980,1979,1978
This statistics in other country:
AfghanistanAlbaniaAlgeriaAngolaAntigua and BarbudaArab WorldArgentinaArmeniaArubaAustraliaAustriaAzerbaijanBahamas, TheBahrainBangladeshBarbadosBelarusBelgiumBelizeBeninBermudaBhutanBoliviaBosnia and HerzegovinaBotswanaBrazilBrunei DarussalamBulgariaBurkina FasoBurundiCabo VerdeCambodiaCameroonCanadaCaribbean small statesCentral African RepublicCentral Europe and the BalticsChadChileChinaColombiaComorosCongo, Dem. Rep.Congo, Rep.Costa RicaCote d'IvoireCroatiaCuracaoCyprusCzech RepublicDenmarkDjiboutiDominicaDominican RepublicEarly-demographic dividendEast Asia & PacificEast Asia & Pacific (excluding high income)East Asia & Pacific (IDA & IBRD countries)EcuadorEgypt, Arab Rep.El SalvadorEquatorial GuineaEritreaEstoniaEthiopiaEuro areaEurope & Central AsiaEurope & Central Asia (excluding high income)Europe & Central Asia (IDA & IBRD countries)European UnionFaroe IslandsFijiFinlandFragile and conflict affected situationsFranceFrench PolynesiaGabonGambia, TheGeorgiaGermanyGhanaGreeceGrenadaGuatemalaGuineaGuinea-BissauGuyanaHaitiHeavily indebted poor countries (HIPC)High incomeHondurasHong Kong SAR, ChinaHungaryIBRD onlyIcelandIDA & IBRD totalIDA blendIDA onlyIDA totalIndiaIndonesiaIran, Islamic Rep.IraqIrelandIsraelItalyJamaicaJapanJordanKazakhstanKenyaKiribatiKorea, Rep.KosovoKuwaitKyrgyz RepublicLao PDRLate-demographic dividendLatin America & Caribbean Latin America & Caribbean (excluding high income)Latin America & the Caribbean (IDA & IBRD countries)LatviaLeast developed countries: UN classificationLebanonLesothoLiberiaLibyaLithuaniaLow & middle incomeLow incomeLower middle incomeLuxembourgMacao SAR, ChinaMacedonia, FYRMadagascarMalawiMalaysiaMaldivesMaliMaltaMarshall IslandsMauritaniaMauritiusMexicoMicronesia, Fed. Sts.Middle East & North Africa (excluding high income)Middle East & North Africa (IDA & IBRD countries)Middle incomeMoldovaMongoliaMontenegroMoroccoMozambiqueMyanmarNamibiaNepalNetherlandsNew CaledoniaNicaraguaNigerNigeriaNorth AmericaNorwayOECD membersOmanPacific island small statesPakistanPalauPanamaPapua New GuineaParaguayPeruPhilippinesPolandPortugalPost-demographic dividendPre-demographic dividendQatarRomaniaRussian FederationRwandaSamoaSao Tome and PrincipeSaudi ArabiaSenegalSerbiaSeychellesSierra LeoneSingaporeSint Maarten (Dutch part)Slovak RepublicSloveniaSolomon IslandsSouth AfricaSouth AsiaSouth Asia (IDA & IBRD)South SudanSpainSri LankaSt. Kitts and NevisSt. LuciaSt. Vincent and the GrenadinesSub-Saharan Africa Sub-Saharan Africa (excluding high income)Sub-Saharan Africa (IDA & IBRD countries)SudanSurinameSwazilandSwedenSwitzerlandSyrian Arab RepublicTajikistanTanzaniaThailandTimor-LesteTogoTongaTrinidad and TobagoTunisiaTurkeyTuvaluUgandaUkraineUnited KingdomUnited StatesUpper middle incomeUruguayVanuatuVenezuela, RBVietnamWest Bank and GazaWorldYemen, Rep.ZambiaZimbabwe Timeline:
This timeline shows a graph from 1978 to 2016 of Latin America & the Caribbean (IDA & IBRD countries). No data until 1977. Number of actual observations by date: 39.
Source name:
World Development Indicators
Source organization:
International Monetary Fund, Balance of Payments Statistics Yearbook and data files.
Categories, topics:
Economy & Growth, Trade
Last updated:
apr 23, 2017
Indicators value changes by year
Minimum:
62.316 bln
jan 1, 1978
Maximum:
1.263 trl
jan 1, 2013
At the date of observation
Value
Absolute change
Change from previous value
jan 1, 1978
62.316 bln
+62.316 bln
0.0%
jan 1, 1979
65.647 bln
+3.331 bln
5.34%
jan 1, 1980
86.068 bln
+20.421 bln
31.11%
jan 1, 1981
110.771 bln
+24.702 bln
28.7%
jan 1, 1982
119.062 bln
+8.292 bln
7.49%
jan 1, 1983
108.269 bln
-10.793 bln
-9.07%
jan 1, 1984
107.126 bln
-1.143 bln
-1.06%
jan 1, 1985
118.659 bln
+11.533 bln
10.77%
jan 1, 1986
113.735 bln
-4.924 bln
-4.15%
jan 1, 1987
99.171 bln
-14.564 bln
-12.8%
jan 1, 1988
112.482 bln
+13.31 bln
13.42%
jan 1, 1989
127.913 bln
+15.431 bln
13.72%
jan 1, 1990
142.01 bln
+14.098 bln
11.02%
jan 1, 1991
158.253 bln
+16.243 bln
11.44%
jan 1, 1992
158.911 bln
+657.561 mln
0.42%
jan 1, 1993
169.642 bln
+10.731 bln
6.75%
jan 1, 1994
181.413 bln
+11.772 bln
6.94%
jan 1, 1995
207.176 bln
+25.762 bln
14.2%
jan 1, 1996
245.776 bln
+38.6 bln
18.63%
jan 1, 1997
269.776 bln
+23.999 bln
9.76%
jan 1, 1998
295.832 bln
+26.057 bln
9.66%
jan 1, 1999
332.012 bln
+36.179 bln
12.23%
jan 1, 2000
347.452 bln
+15.44 bln
4.65%
jan 1, 2001
414.267 bln
+66.815 bln
19.23%
jan 1, 2002
398.599 bln
-15.667 bln
-3.78%
jan 1, 2003
400.544 bln
+1.945 bln
0.49%
jan 1, 2004
436.68 bln
+36.136 bln
9.02%
jan 1, 2005
536.612 bln
+99.932 bln
22.88%
jan 1, 2006
646.84 bln
+110.228 bln
20.54%
jan 1, 2007
769.561 bln
+122.721 bln
18.97%
jan 1, 2008
870.658 bln
+101.098 bln
13.14%
jan 1, 2009
1.015 trl
+144.205 bln
16.56%
jan 1, 2010
802.049 bln
-212.815 bln
-20.97%
jan 1, 2011
1.004 trl
+202.39 bln
25.23%
jan 1, 2012
1.238 trl
+233.903 bln
23.29%
jan 1, 2013
1.263 trl
+25.02 bln
2.02%
jan 1, 2014
1.26 trl
-3.215 bln
-0.25%
jan 1, 2015
1.233 trl
-26.976 bln
-2.14%
jan 1, 2016
1.073 trl
-160.411 bln
-13.01%
Ranking of countries by current statistics by years


Comments: