29
/
en
AIzaSyAYiBZKx7MnpbEhh9jyipgxe19OcubqV5w
April 1, 2024
224786
Poland
POL
true
2
1
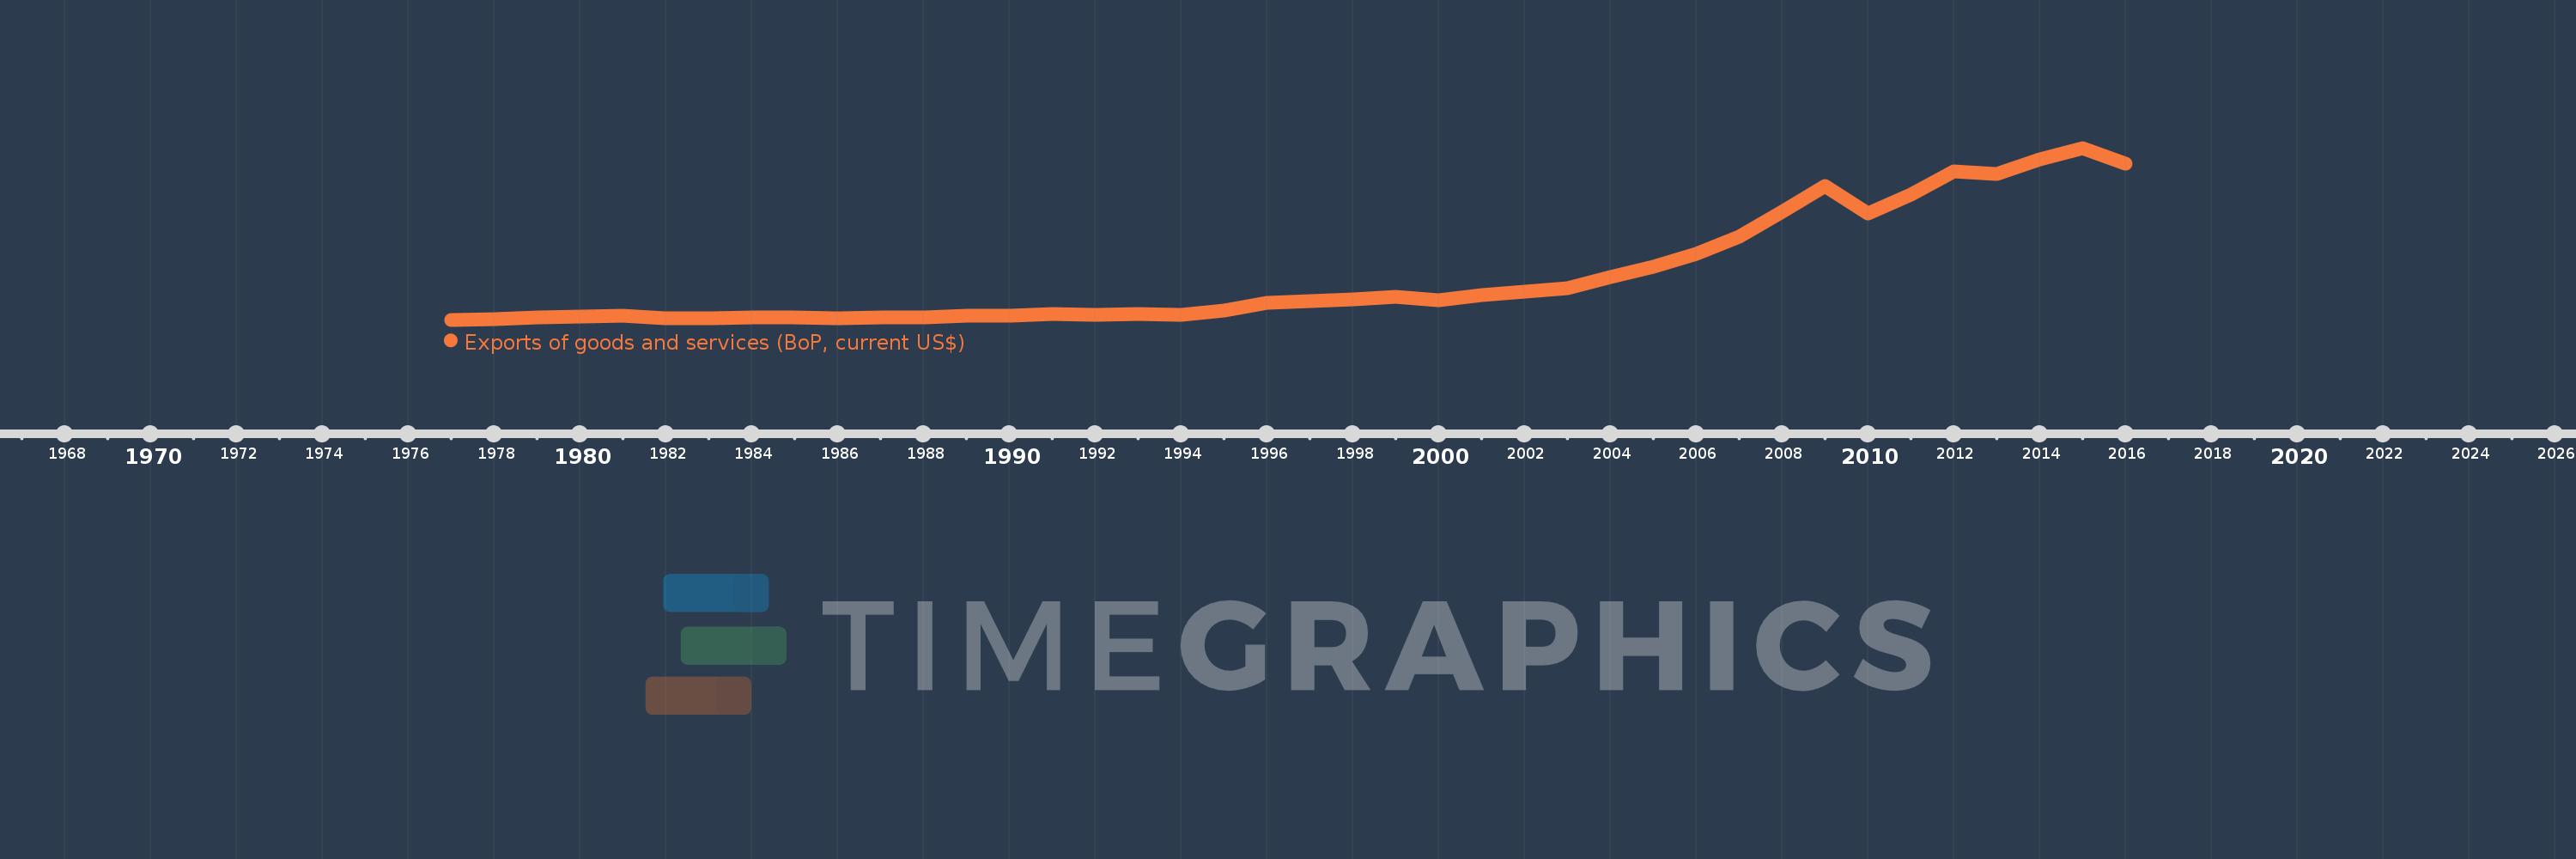
Exports of goods and services (BoP, current US$)
2016,2015,2014,2013,2012,2011,2010,2009,2008,2007,2006,2005,2004,2003,2002,2001,2000,1999,1998,1997,1996,1995,1994,1993,1992,1991,1990,1989,1988,1987,1986,1985,1984,1983,1982,1981,1980,1979,1978,1977
This statistics in other country:
AfghanistanAlbaniaAlgeriaAngolaAntigua and BarbudaArab WorldArgentinaArmeniaArubaAustraliaAustriaAzerbaijanBahamas, TheBahrainBangladeshBarbadosBelarusBelgiumBelizeBeninBermudaBhutanBoliviaBosnia and HerzegovinaBotswanaBrazilBrunei DarussalamBulgariaBurkina FasoBurundiCabo VerdeCambodiaCameroonCanadaCaribbean small statesCentral African RepublicCentral Europe and the BalticsChadChileChinaColombiaComorosCongo, Dem. Rep.Congo, Rep.Costa RicaCote d'IvoireCroatiaCuracaoCyprusCzech RepublicDenmarkDjiboutiDominicaDominican RepublicEarly-demographic dividendEast Asia & PacificEast Asia & Pacific (excluding high income)East Asia & Pacific (IDA & IBRD countries)EcuadorEgypt, Arab Rep.El SalvadorEquatorial GuineaEritreaEstoniaEthiopiaEuro areaEurope & Central AsiaEurope & Central Asia (excluding high income)Europe & Central Asia (IDA & IBRD countries)European UnionFaroe IslandsFijiFinlandFragile and conflict affected situationsFranceFrench PolynesiaGabonGambia, TheGeorgiaGermanyGhanaGreeceGrenadaGuatemalaGuineaGuinea-BissauGuyanaHaitiHeavily indebted poor countries (HIPC)High incomeHondurasHong Kong SAR, ChinaHungaryIBRD onlyIcelandIDA & IBRD totalIDA blendIDA onlyIDA totalIndiaIndonesiaIran, Islamic Rep.IraqIrelandIsraelItalyJamaicaJapanJordanKazakhstanKenyaKiribatiKorea, Rep.KosovoKuwaitKyrgyz RepublicLao PDRLate-demographic dividendLatin America & Caribbean Latin America & Caribbean (excluding high income)Latin America & the Caribbean (IDA & IBRD countries)LatviaLeast developed countries: UN classificationLebanonLesothoLiberiaLibyaLithuaniaLow & middle incomeLow incomeLower middle incomeLuxembourgMacao SAR, ChinaMacedonia, FYRMadagascarMalawiMalaysiaMaldivesMaliMaltaMarshall IslandsMauritaniaMauritiusMexicoMicronesia, Fed. Sts.Middle East & North Africa (excluding high income)Middle East & North Africa (IDA & IBRD countries)Middle incomeMoldovaMongoliaMontenegroMoroccoMozambiqueMyanmarNamibiaNepalNetherlandsNew CaledoniaNicaraguaNigerNigeriaNorth AmericaNorwayOECD membersOmanPacific island small statesPakistanPalauPanamaPapua New GuineaParaguayPeruPhilippinesPolandPortugalPost-demographic dividendPre-demographic dividendQatarRomaniaRussian FederationRwandaSamoaSao Tome and PrincipeSaudi ArabiaSenegalSerbiaSeychellesSierra LeoneSingaporeSint Maarten (Dutch part)Slovak RepublicSloveniaSolomon IslandsSouth AfricaSouth AsiaSouth Asia (IDA & IBRD)South SudanSpainSri LankaSt. Kitts and NevisSt. LuciaSt. Vincent and the GrenadinesSub-Saharan Africa Sub-Saharan Africa (excluding high income)Sub-Saharan Africa (IDA & IBRD countries)SudanSurinameSwazilandSwedenSwitzerlandSyrian Arab RepublicTajikistanTanzaniaThailandTimor-LesteTogoTongaTrinidad and TobagoTunisiaTurkeyTuvaluUgandaUkraineUnited KingdomUnited StatesUpper middle incomeUruguayVanuatuVenezuela, RBVietnamWest Bank and GazaWorldYemen, Rep.ZambiaZimbabwe Timeline:
This timeline shows a graph from 1977 to 2016 of Poland. No data until 1976. Number of actual observations by date: 40.
Source name:
World Development Indicators
Source organization:
International Monetary Fund, Balance of Payments Statistics Yearbook and data files.
Categories, topics:
Economy & Growth, Trade
Last updated:
apr 23, 2017
Indicators value changes by year
Minimum:
10.686 bln
jan 1, 1977
Maximum:
259.35 bln
jan 1, 2015
At the date of observation
Value
Absolute change
Change from previous value
jan 1, 1977
10.686 bln
+10.686 bln
0.0%
jan 1, 1978
11.891 bln
+1.205 bln
11.28%
jan 1, 1979
13.553 bln
+1.662 bln
13.98%
jan 1, 1980
15.15 bln
+1.597 bln
11.78%
jan 1, 1981
16.061 bln
+911.0 mln
6.01%
jan 1, 1982
12.455 bln
-3.606 bln
-22.45%
jan 1, 1983
13.389 bln
+934.0 mln
7.5%
jan 1, 1984
13.605 bln
+216.0 mln
1.61%
jan 1, 1985
13.671 bln
+66.0 mln
0.49%
jan 1, 1986
13.049 bln
-622.0 mln
-4.55%
jan 1, 1987
13.941 bln
+892.0 mln
6.84%
jan 1, 1988
14.242 bln
+301.0 mln
2.16%
jan 1, 1989
16.318 bln
+2.076 bln
14.58%
jan 1, 1990
16.07 bln
-248.0 mln
-1.52%
jan 1, 1991
19.037 bln
+2.967 bln
18.46%
jan 1, 1992
18.08 bln
-957.0 mln
-5.03%
jan 1, 1993
18.702 bln
+622.0 mln
3.44%
jan 1, 1994
17.783 bln
-919.0 mln
-4.91%
jan 1, 1995
23.723 bln
+5.94 bln
33.4%
jan 1, 1996
35.716 bln
+11.993 bln
50.55%
jan 1, 1997
37.304 bln
+1.588 bln
4.45%
jan 1, 1998
39.646 bln
+2.342 bln
6.28%
jan 1, 1999
43.307 bln
+3.661 bln
9.23%
jan 1, 2000
38.423 bln
-4.884 bln
-11.28%
jan 1, 2001
46.301 bln
+7.878 bln
20.5%
jan 1, 2002
51.416 bln
+5.115 bln
11.05%
jan 1, 2003
56.779 bln
+5.363 bln
10.43%
jan 1, 2004
72.181 bln
+15.402 bln
27.13%
jan 1, 2005
87.966 bln
+15.785 bln
21.87%
jan 1, 2006
105.9 bln
+17.934 bln
20.39%
jan 1, 2007
130.742 bln
+24.842 bln
23.46%
jan 1, 2008
166.51 bln
+35.768 bln
27.36%
jan 1, 2009
204.745 bln
+38.235 bln
22.96%
jan 1, 2010
164.715 bln
-40.03 bln
-19.55%
jan 1, 2011
191.942 bln
+27.227 bln
16.53%
jan 1, 2012
225.351 bln
+33.409 bln
17.41%
jan 1, 2013
222.283 bln
-3.068 bln
-1.36%
jan 1, 2014
242.733 bln
+20.45 bln
9.2%
jan 1, 2015
259.35 bln
+16.617 bln
6.85%
jan 1, 2016
236.119 bln
-23.231 bln
-8.96%
Ranking of countries by current statistics by years


Comments: