29
/
en
AIzaSyAYiBZKx7MnpbEhh9jyipgxe19OcubqV5w
April 1, 2024
30636
Europe & Central Asia
ECS
false
2
1
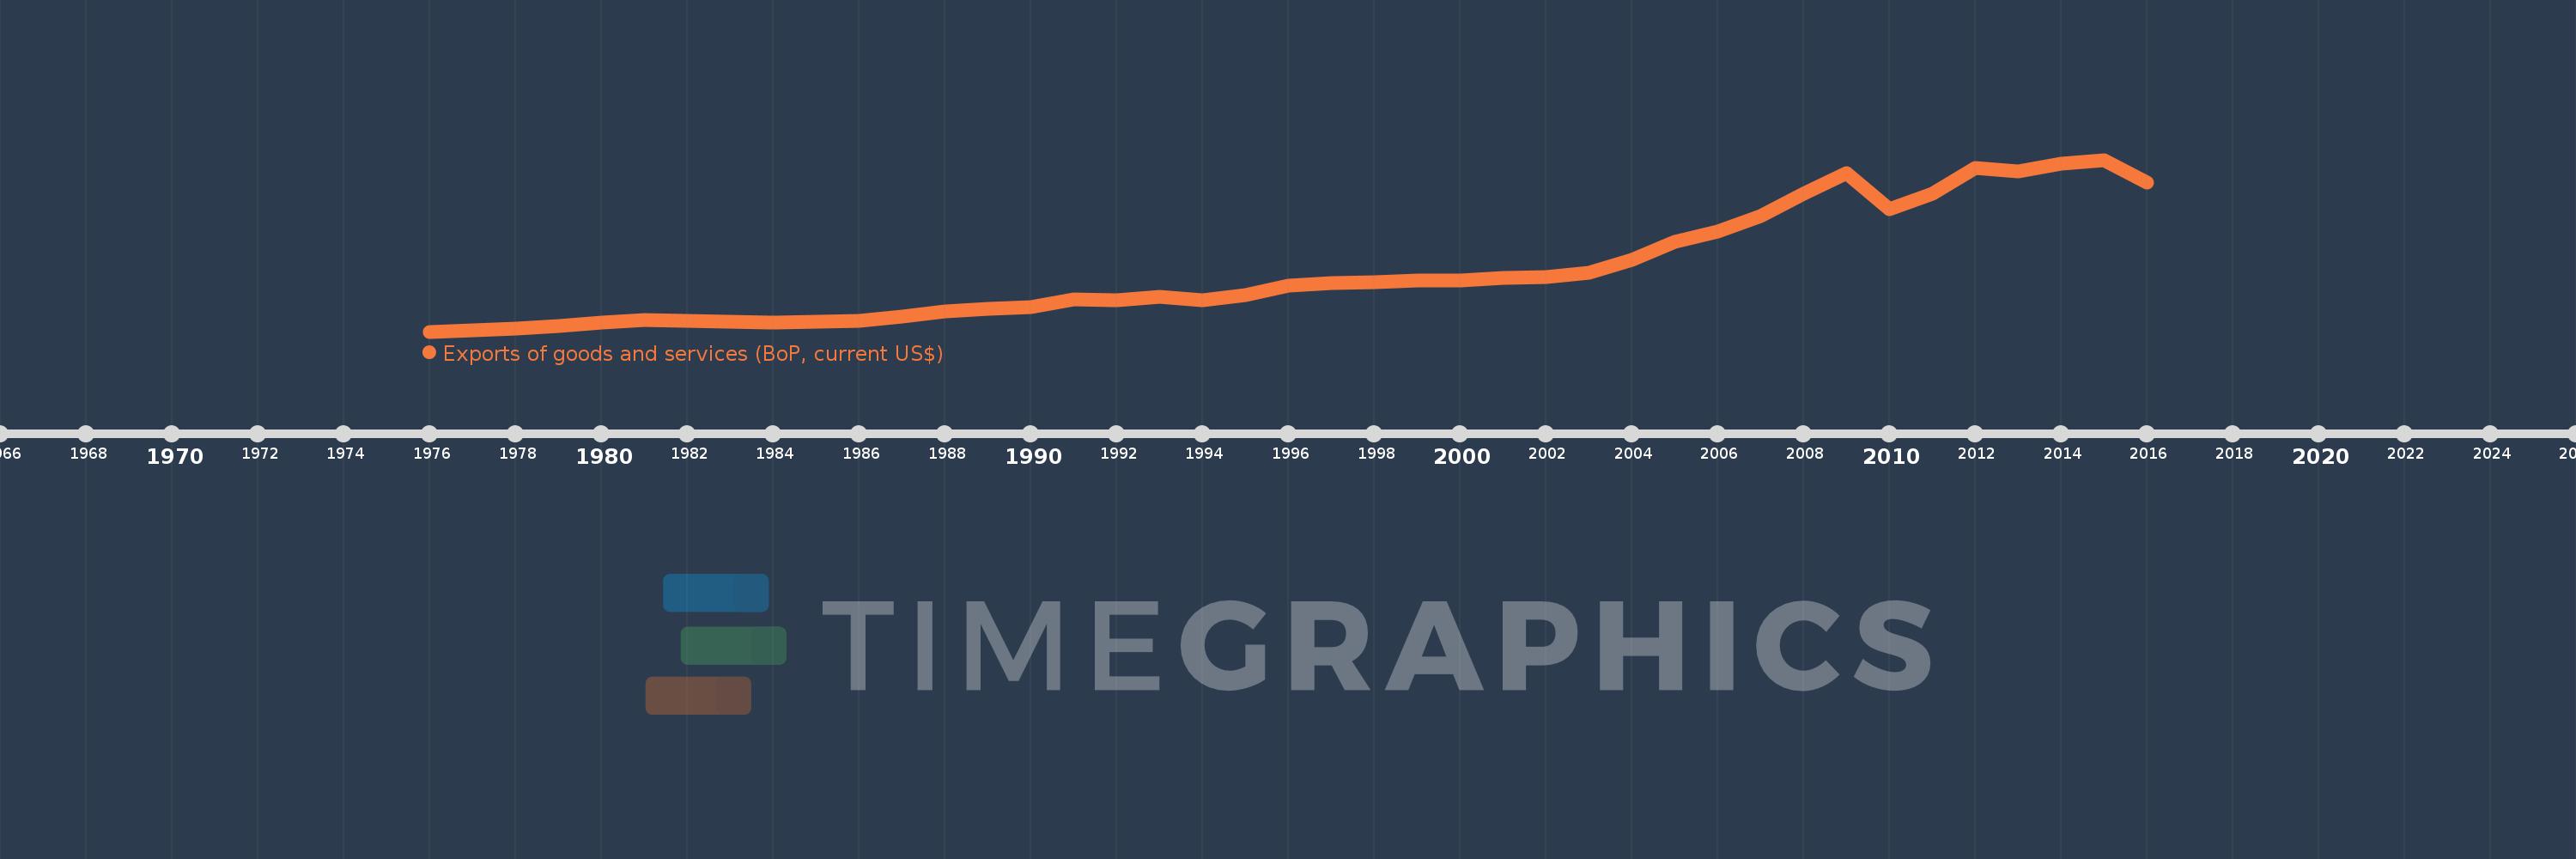
Exports of goods and services (BoP, current US$)
2016,2015,2014,2013,2012,2011,2010,2009,2008,2007,2006,2005,2004,2003,2002,2001,2000,1999,1998,1997,1996,1995,1994,1993,1992,1991,1990,1989,1988,1987,1986,1985,1984,1983,1982,1981,1980,1979,1978,1977,1976
This statistics in other country:
AfghanistanAlbaniaAlgeriaAngolaAntigua and BarbudaArab WorldArgentinaArmeniaArubaAustraliaAustriaAzerbaijanBahamas, TheBahrainBangladeshBarbadosBelarusBelgiumBelizeBeninBermudaBhutanBoliviaBosnia and HerzegovinaBotswanaBrazilBrunei DarussalamBulgariaBurkina FasoBurundiCabo VerdeCambodiaCameroonCanadaCaribbean small statesCentral African RepublicCentral Europe and the BalticsChadChileChinaColombiaComorosCongo, Dem. Rep.Congo, Rep.Costa RicaCote d'IvoireCroatiaCuracaoCyprusCzech RepublicDenmarkDjiboutiDominicaDominican RepublicEarly-demographic dividendEast Asia & PacificEast Asia & Pacific (excluding high income)East Asia & Pacific (IDA & IBRD countries)EcuadorEgypt, Arab Rep.El SalvadorEquatorial GuineaEritreaEstoniaEthiopiaEuro areaEurope & Central AsiaEurope & Central Asia (excluding high income)Europe & Central Asia (IDA & IBRD countries)European UnionFaroe IslandsFijiFinlandFragile and conflict affected situationsFranceFrench PolynesiaGabonGambia, TheGeorgiaGermanyGhanaGreeceGrenadaGuatemalaGuineaGuinea-BissauGuyanaHaitiHeavily indebted poor countries (HIPC)High incomeHondurasHong Kong SAR, ChinaHungaryIBRD onlyIcelandIDA & IBRD totalIDA blendIDA onlyIDA totalIndiaIndonesiaIran, Islamic Rep.IraqIrelandIsraelItalyJamaicaJapanJordanKazakhstanKenyaKiribatiKorea, Rep.KosovoKuwaitKyrgyz RepublicLao PDRLate-demographic dividendLatin America & Caribbean Latin America & Caribbean (excluding high income)Latin America & the Caribbean (IDA & IBRD countries)LatviaLeast developed countries: UN classificationLebanonLesothoLiberiaLibyaLithuaniaLow & middle incomeLow incomeLower middle incomeLuxembourgMacao SAR, ChinaMacedonia, FYRMadagascarMalawiMalaysiaMaldivesMaliMaltaMarshall IslandsMauritaniaMauritiusMexicoMicronesia, Fed. Sts.Middle East & North Africa (excluding high income)Middle East & North Africa (IDA & IBRD countries)Middle incomeMoldovaMongoliaMontenegroMoroccoMozambiqueMyanmarNamibiaNepalNetherlandsNew CaledoniaNicaraguaNigerNigeriaNorth AmericaNorwayOECD membersOmanPacific island small statesPakistanPalauPanamaPapua New GuineaParaguayPeruPhilippinesPolandPortugalPost-demographic dividendPre-demographic dividendQatarRomaniaRussian FederationRwandaSamoaSao Tome and PrincipeSaudi ArabiaSenegalSerbiaSeychellesSierra LeoneSingaporeSint Maarten (Dutch part)Slovak RepublicSloveniaSolomon IslandsSouth AfricaSouth AsiaSouth Asia (IDA & IBRD)South SudanSpainSri LankaSt. Kitts and NevisSt. LuciaSt. Vincent and the GrenadinesSub-Saharan Africa Sub-Saharan Africa (excluding high income)Sub-Saharan Africa (IDA & IBRD countries)SudanSurinameSwazilandSwedenSwitzerlandSyrian Arab RepublicTajikistanTanzaniaThailandTimor-LesteTogoTongaTrinidad and TobagoTunisiaTurkeyTuvaluUgandaUkraineUnited KingdomUnited StatesUpper middle incomeUruguayVanuatuVenezuela, RBVietnamWest Bank and GazaWorldYemen, Rep.ZambiaZimbabwe Timeline:
This timeline shows a graph from 1976 to 2016 of Europe & Central Asia. No data until 1975. Number of actual observations by date: 41.
Source name:
World Development Indicators
Source organization:
International Monetary Fund, Balance of Payments Statistics Yearbook and data files.
Categories, topics:
Economy & Growth, Trade
Last updated:
apr 23, 2017
Indicators value changes by year
Minimum:
531.192 bln
jan 1, 1976
Maximum:
9.765 trl
jan 1, 2015
At the date of observation
Value
Absolute change
Change from previous value
jan 1, 1976
531.192 bln
+531.192 bln
0.0%
jan 1, 1977
582.966 bln
+51.774 bln
9.75%
jan 1, 1978
672.365 bln
+89.399 bln
15.34%
jan 1, 1979
816.709 bln
+144.344 bln
21.47%
jan 1, 1980
1.013 trl
+195.904 bln
23.99%
jan 1, 1981
1.168 trl
+155.403 bln
15.35%
jan 1, 1982
1.106 trl
-62.34 bln
-5.34%
jan 1, 1983
1.061 trl
-45.122 bln
-4.08%
jan 1, 1984
1.03 trl
-30.333 bln
-2.86%
jan 1, 1985
1.057 trl
+27.205 bln
2.64%
jan 1, 1986
1.108 trl
+50.922 bln
4.82%
jan 1, 1987
1.335 trl
+226.538 bln
20.44%
jan 1, 1988
1.597 trl
+261.922 bln
19.62%
jan 1, 1989
1.767 trl
+169.762 bln
10.63%
jan 1, 1990
1.868 trl
+101.269 bln
5.73%
jan 1, 1991
2.252 trl
+384.075 bln
20.56%
jan 1, 1992
2.236 trl
-15.941 bln
-0.71%
jan 1, 1993
2.407 trl
+170.539 bln
7.63%
jan 1, 1994
2.223 trl
-184.006 bln
-7.65%
jan 1, 1995
2.478 trl
+255.447 bln
11.49%
jan 1, 1996
3.024 trl
+545.693 bln
22.02%
jan 1, 1997
3.158 trl
+134.291 bln
4.44%
jan 1, 1998
3.175 trl
+16.647 bln
0.53%
jan 1, 1999
3.258 trl
+83.662 bln
2.64%
jan 1, 2000
3.275 trl
+16.475 bln
0.51%
jan 1, 2001
3.432 trl
+157.692 bln
4.82%
jan 1, 2002
3.474 trl
+42.006 bln
1.22%
jan 1, 2003
3.692 trl
+217.534 bln
6.26%
jan 1, 2004
4.405 trl
+713.536 bln
19.33%
jan 1, 2005
5.374 trl
+968.441 bln
21.98%
jan 1, 2006
5.922 trl
+548.034 bln
10.2%
jan 1, 2007
6.748 trl
+825.74 bln
13.94%
jan 1, 2008
7.956 trl
+1.209 trl
17.91%
jan 1, 2009
9.045 trl
+1.089 trl
13.69%
jan 1, 2010
7.109 trl
-1.937 trl
-21.41%
jan 1, 2011
7.919 trl
+810.205 bln
11.4%
jan 1, 2012
9.339 trl
+1.421 trl
17.94%
jan 1, 2013
9.136 trl
-203.877 bln
-2.18%
jan 1, 2014
9.554 trl
+418.055 bln
4.58%
jan 1, 2015
9.765 trl
+211.045 bln
2.21%
jan 1, 2016
8.53 trl
-1.234 trl
-12.64%
Ranking of countries by current statistics by years


Comments: