29
/
en
AIzaSyAYiBZKx7MnpbEhh9jyipgxe19OcubqV5w
April 1, 2024
251831
St. Vincent and the Grenadines
VCT
true
2
1
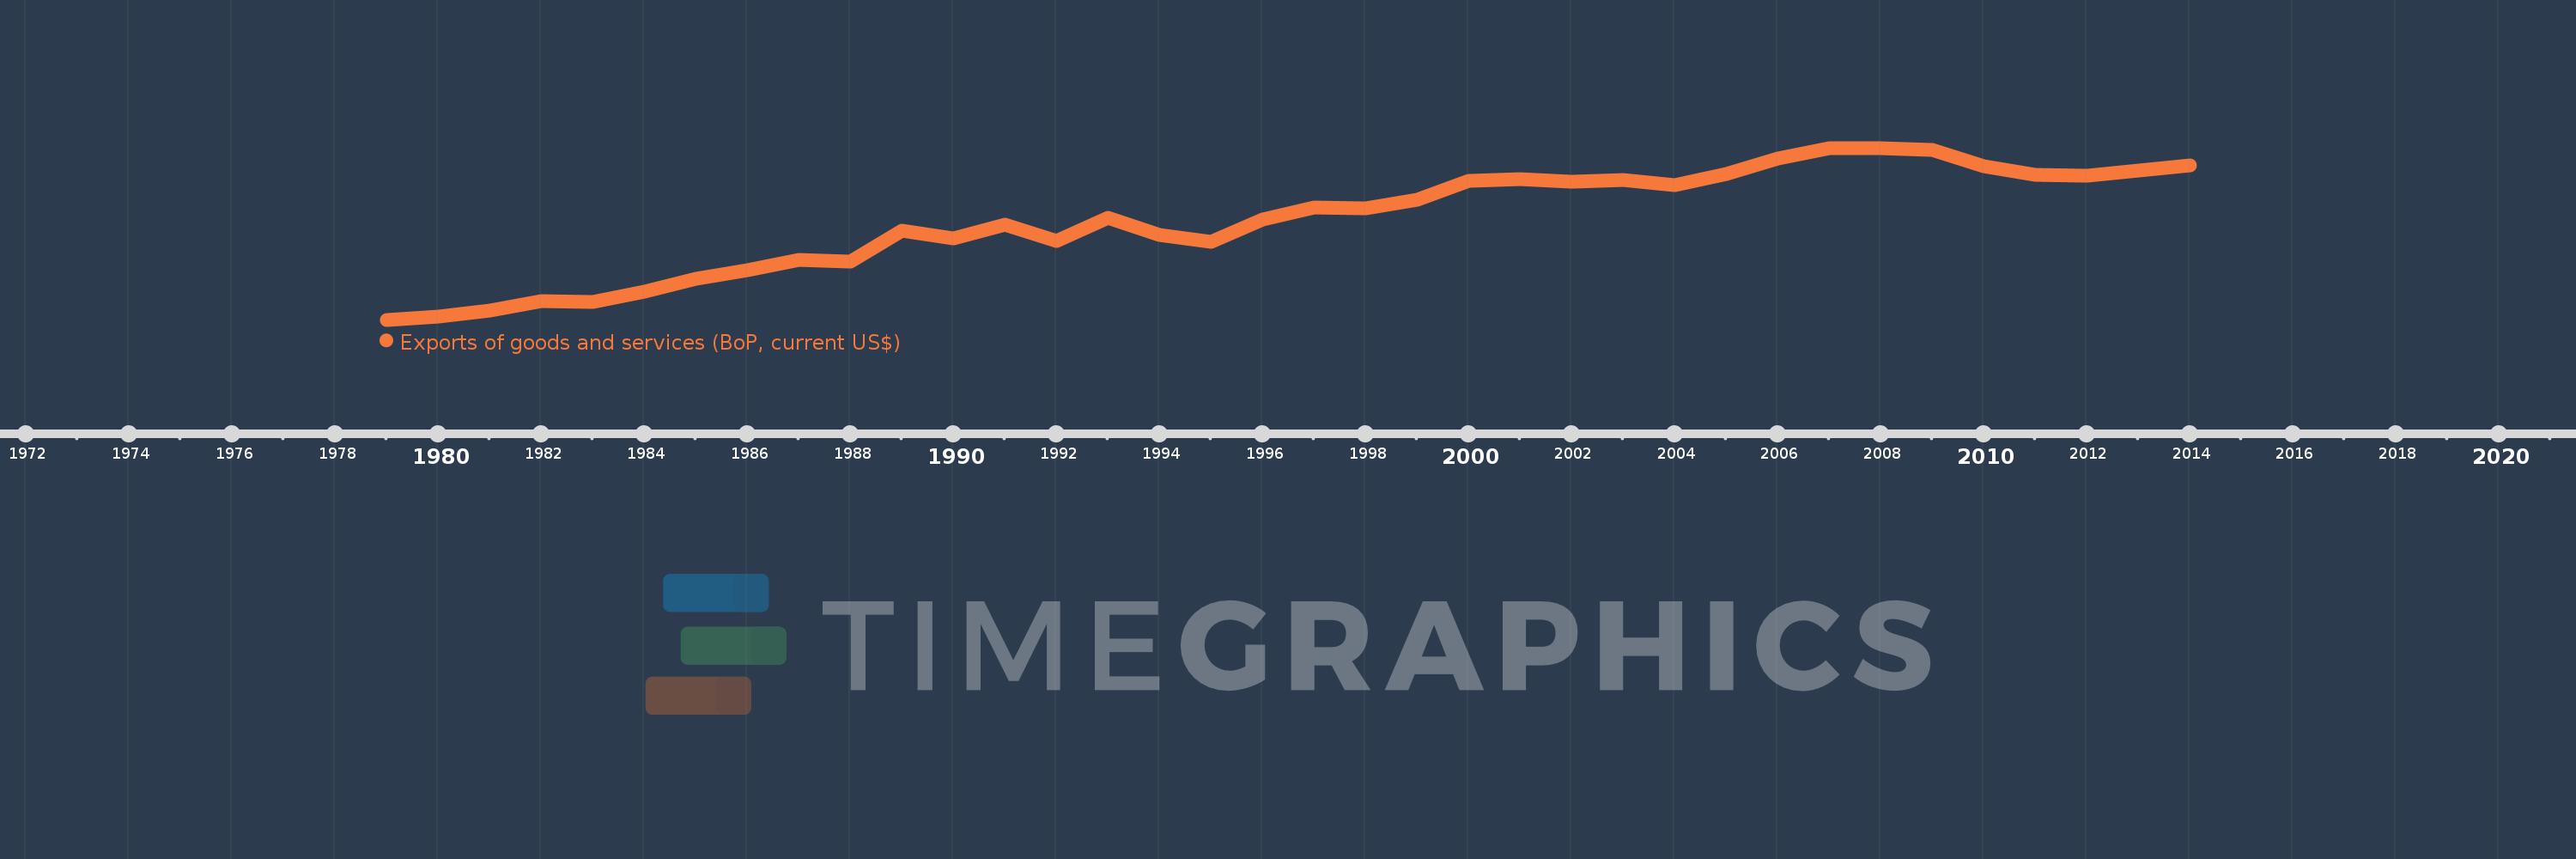
Exports of goods and services (BoP, current US$)
2014,2013,2012,2011,2010,2009,2008,2007,2006,2005,2004,2003,2002,2001,2000,1999,1998,1997,1996,1995,1994,1993,1992,1991,1990,1989,1988,1987,1986,1985,1984,1983,1982,1981,1980,1979
This statistics in other country:
AfghanistanAlbaniaAlgeriaAngolaAntigua and BarbudaArab WorldArgentinaArmeniaArubaAustraliaAustriaAzerbaijanBahamas, TheBahrainBangladeshBarbadosBelarusBelgiumBelizeBeninBermudaBhutanBoliviaBosnia and HerzegovinaBotswanaBrazilBrunei DarussalamBulgariaBurkina FasoBurundiCabo VerdeCambodiaCameroonCanadaCaribbean small statesCentral African RepublicCentral Europe and the BalticsChadChileChinaColombiaComorosCongo, Dem. Rep.Congo, Rep.Costa RicaCote d'IvoireCroatiaCuracaoCyprusCzech RepublicDenmarkDjiboutiDominicaDominican RepublicEarly-demographic dividendEast Asia & PacificEast Asia & Pacific (excluding high income)East Asia & Pacific (IDA & IBRD countries)EcuadorEgypt, Arab Rep.El SalvadorEquatorial GuineaEritreaEstoniaEthiopiaEuro areaEurope & Central AsiaEurope & Central Asia (excluding high income)Europe & Central Asia (IDA & IBRD countries)European UnionFaroe IslandsFijiFinlandFragile and conflict affected situationsFranceFrench PolynesiaGabonGambia, TheGeorgiaGermanyGhanaGreeceGrenadaGuatemalaGuineaGuinea-BissauGuyanaHaitiHeavily indebted poor countries (HIPC)High incomeHondurasHong Kong SAR, ChinaHungaryIBRD onlyIcelandIDA & IBRD totalIDA blendIDA onlyIDA totalIndiaIndonesiaIran, Islamic Rep.IraqIrelandIsraelItalyJamaicaJapanJordanKazakhstanKenyaKiribatiKorea, Rep.KosovoKuwaitKyrgyz RepublicLao PDRLate-demographic dividendLatin America & Caribbean Latin America & Caribbean (excluding high income)Latin America & the Caribbean (IDA & IBRD countries)LatviaLeast developed countries: UN classificationLebanonLesothoLiberiaLibyaLithuaniaLow & middle incomeLow incomeLower middle incomeLuxembourgMacao SAR, ChinaMacedonia, FYRMadagascarMalawiMalaysiaMaldivesMaliMaltaMarshall IslandsMauritaniaMauritiusMexicoMicronesia, Fed. Sts.Middle East & North Africa (excluding high income)Middle East & North Africa (IDA & IBRD countries)Middle incomeMoldovaMongoliaMontenegroMoroccoMozambiqueMyanmarNamibiaNepalNetherlandsNew CaledoniaNicaraguaNigerNigeriaNorth AmericaNorwayOECD membersOmanPacific island small statesPakistanPalauPanamaPapua New GuineaParaguayPeruPhilippinesPolandPortugalPost-demographic dividendPre-demographic dividendQatarRomaniaRussian FederationRwandaSamoaSao Tome and PrincipeSaudi ArabiaSenegalSerbiaSeychellesSierra LeoneSingaporeSint Maarten (Dutch part)Slovak RepublicSloveniaSolomon IslandsSouth AfricaSouth AsiaSouth Asia (IDA & IBRD)South SudanSpainSri LankaSt. Kitts and NevisSt. LuciaSt. Vincent and the GrenadinesSub-Saharan Africa Sub-Saharan Africa (excluding high income)Sub-Saharan Africa (IDA & IBRD countries)SudanSurinameSwazilandSwedenSwitzerlandSyrian Arab RepublicTajikistanTanzaniaThailandTimor-LesteTogoTongaTrinidad and TobagoTunisiaTurkeyTuvaluUgandaUkraineUnited KingdomUnited StatesUpper middle incomeUruguayVanuatuVenezuela, RBVietnamWest Bank and GazaWorldYemen, Rep.ZambiaZimbabwe Timeline:
This timeline shows a graph from 1979 to 2014 of St. Vincent and the Grenadines. No data until 1978. Number of actual observations by date: 36.
Source name:
World Development Indicators
Source organization:
International Monetary Fund, Balance of Payments Statistics Yearbook and data files.
Categories, topics:
Economy & Growth, Trade
Last updated:
apr 23, 2017
Indicators value changes by year
Minimum:
29.2 mln
jan 1, 1979
Maximum:
212.22 mln
jan 1, 2008
At the date of observation
Value
Absolute change
Change from previous value
jan 1, 1979
29.2 mln
+29.2 mln
0.0%
jan 1, 1980
32.8 mln
+3.6 mln
12.33%
jan 1, 1981
38.8 mln
+6.0 mln
18.29%
jan 1, 1982
48.7 mln
+9.9 mln
25.52%
jan 1, 1983
47.89 mln
-809.63K
-1.66%
jan 1, 1984
58.9 mln
+11.01 mln
22.99%
jan 1, 1985
72.7 mln
+13.8 mln
23.43%
jan 1, 1986
82.4 mln
+9.7 mln
13.34%
jan 1, 1987
92.889 mln
+10.489 mln
12.73%
jan 1, 1988
91.096 mln
-1.793 mln
-1.93%
jan 1, 1989
124.504 mln
+33.407 mln
36.67%
jan 1, 1990
115.511 mln
-8.993 mln
-7.22%
jan 1, 1991
130.167 mln
+14.656 mln
12.69%
jan 1, 1992
113.363 mln
-16.804 mln
-12.91%
jan 1, 1993
137.967 mln
+24.604 mln
21.7%
jan 1, 1994
119.481 mln
-18.485 mln
-13.4%
jan 1, 1995
112.256 mln
-7.226 mln
-6.05%
jan 1, 1996
136.311 mln
+24.056 mln
21.43%
jan 1, 1997
149.237 mln
+12.926 mln
9.48%
jan 1, 1998
148.344 mln
-892.593K
-0.6%
jan 1, 1999
157.415 mln
+9.07 mln
6.11%
jan 1, 2000
177.185 mln
+19.77 mln
12.56%
jan 1, 2001
179.415 mln
+2.23 mln
1.26%
jan 1, 2002
175.943 mln
-3.471 mln
-1.93%
jan 1, 2003
178.313 mln
+2.369 mln
1.35%
jan 1, 2004
172.849 mln
-5.464 mln
-3.06%
jan 1, 2005
184.518 mln
+11.669 mln
6.75%
jan 1, 2006
200.545 mln
+16.026 mln
8.69%
jan 1, 2007
211.994 mln
+11.45 mln
5.71%
jan 1, 2008
212.22 mln
+225.721K
0.11%
jan 1, 2009
210.168 mln
-2.052 mln
-0.97%
jan 1, 2010
192.308 mln
-17.861 mln
-8.5%
jan 1, 2011
183.185 mln
-9.122 mln
-4.74%
jan 1, 2012
182.794 mln
-391.205K
-0.21%
jan 1, 2013
188.277 mln
+5.483 mln
3.0%
jan 1, 2014
194.023 mln
+5.746 mln
3.05%
Ranking of countries by current statistics by years


Comments: