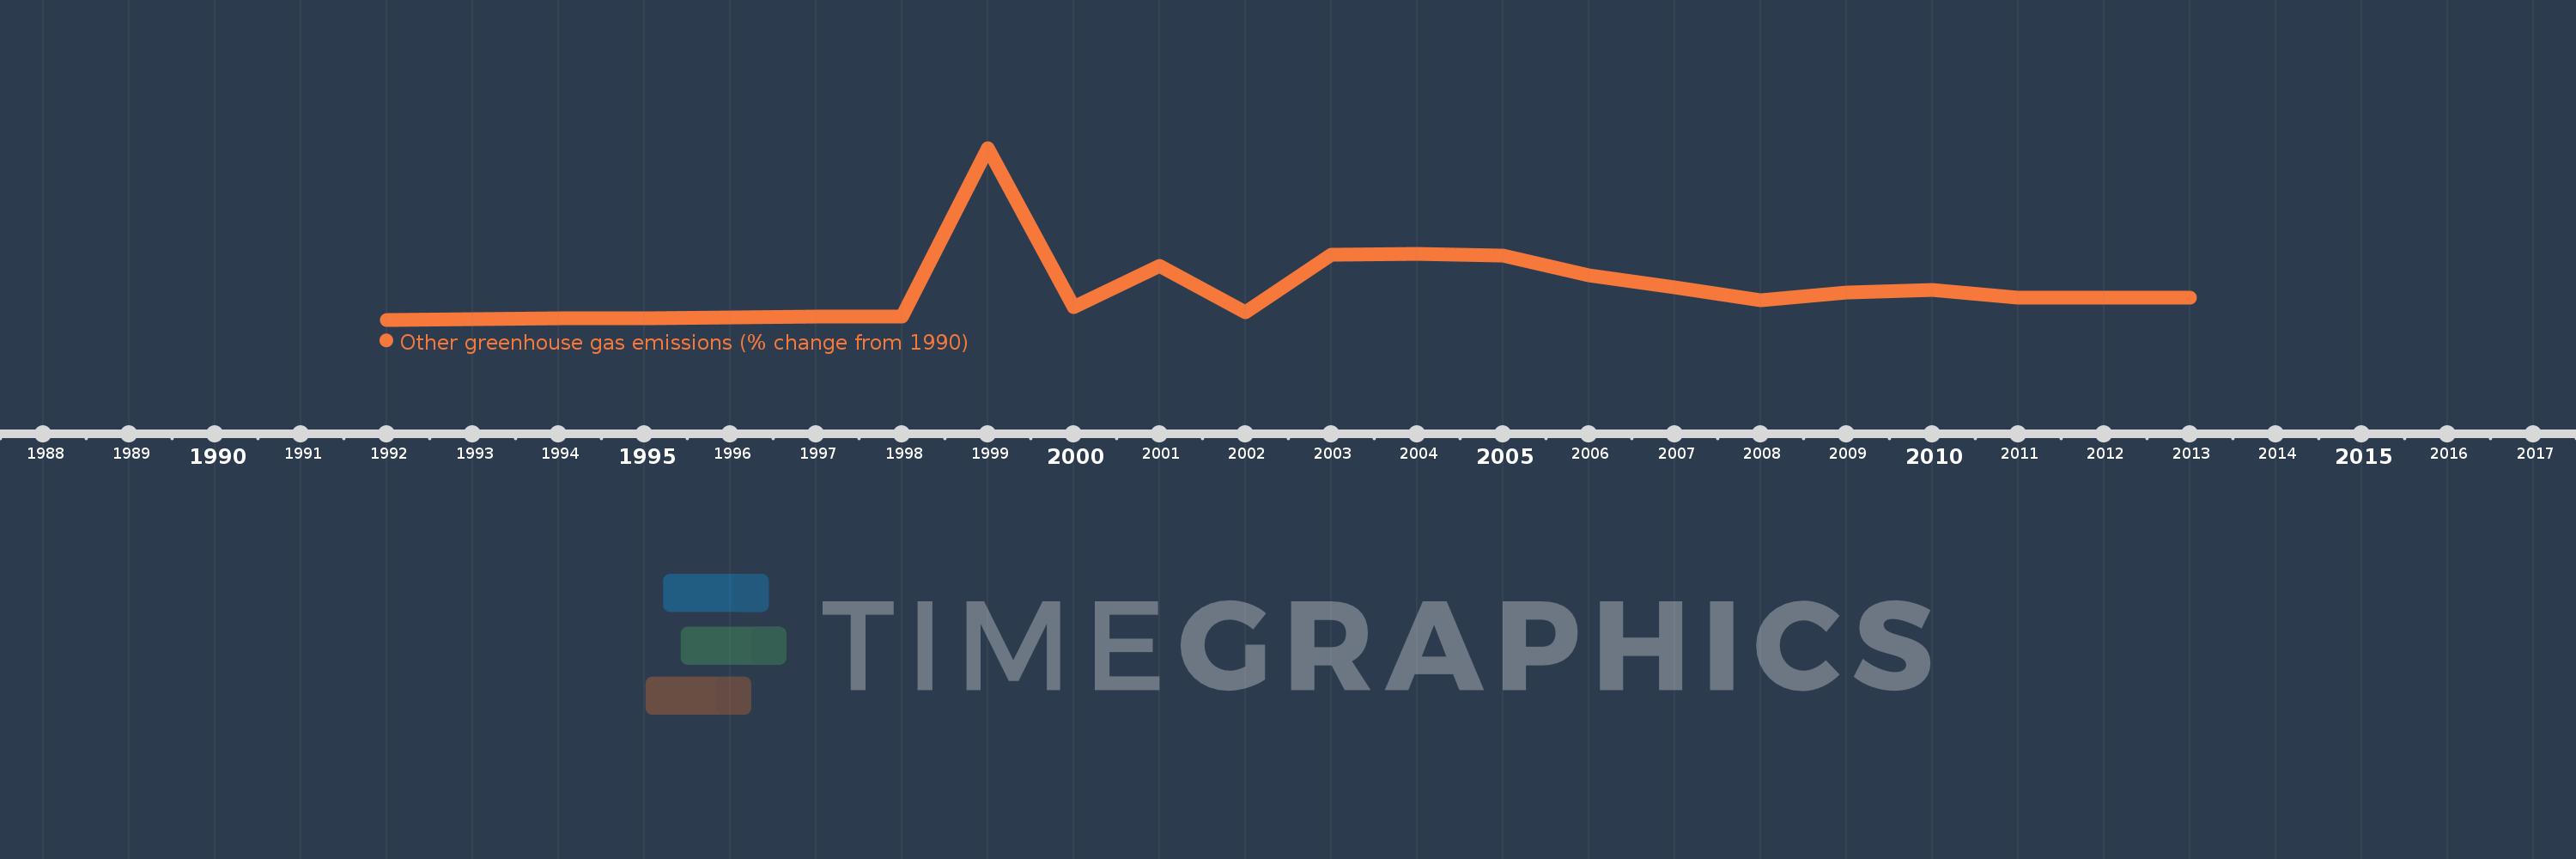
This timeline shows a graph from 1992 to 2013 of Burundi. No data until 1991. Number of actual observations by date: 22.
Source name:
World Development Indicators
Source organization:
World Bank staff estimates from original source: European Commission, Joint Research Centre (JRC)/Netherlands Environmental Assessment Agency (PBL). Emission Database for Global Atmospheric Research (EDGAR): http://edgar.jrc.ec.europa.eu/.
Categories, topics:
Climate Change, Environment
Last updated:
apr 23, 2017
Indicators value changes by year
Meaning:
864.438
Minimum:
15.197
jan 1, 1992
Maximum:
4.802K
jan 1, 1999
At the date of observation
Value
Absolute change
Change from the previous value
jan 1, 1992
15.197
+15.197
0.0%
jan 1, 1993
30.436
+15.239
100.28%
jan 1, 1994
45.718
+15.282
50.21%
jan 1, 1995
61.044
+15.325
33.52%
jan 1, 1996
76.412
+15.368
25.18%
jan 1, 1997
91.822
+15.41
20.17%
jan 1, 1998
107.276
+15.454
16.83%
jan 1, 1999
4.802K
+4.694K
4.38K%
jan 1, 2000
356.638
-4.445K
-92.57%
jan 1, 2001
1.506K
+1.149K
322.18%
jan 1, 2002
225.953
-1.28K
-84.99%
jan 1, 2003
1.828K
+1.602K
709.18%
jan 1, 2004
1.845K
+16.772
0.92%
jan 1, 2005
1.797K
-48.235
-2.61%
jan 1, 2006
1.243K
-554.154
-30.84%
jan 1, 2007
906.377
-336.377
-27.07%
jan 1, 2008
554.268
-352.109
-38.85%
jan 1, 2009
777.449
+223.181
40.27%
jan 1, 2010
840.484
+63.035
8.11%
jan 1, 2011
636.048
-204.436
-24.32%
jan 1, 2012
636.048
+0.0
0.0%
jan 1, 2013
636.048
0.0
0.0%
Ranking of countries by current statistics by years
