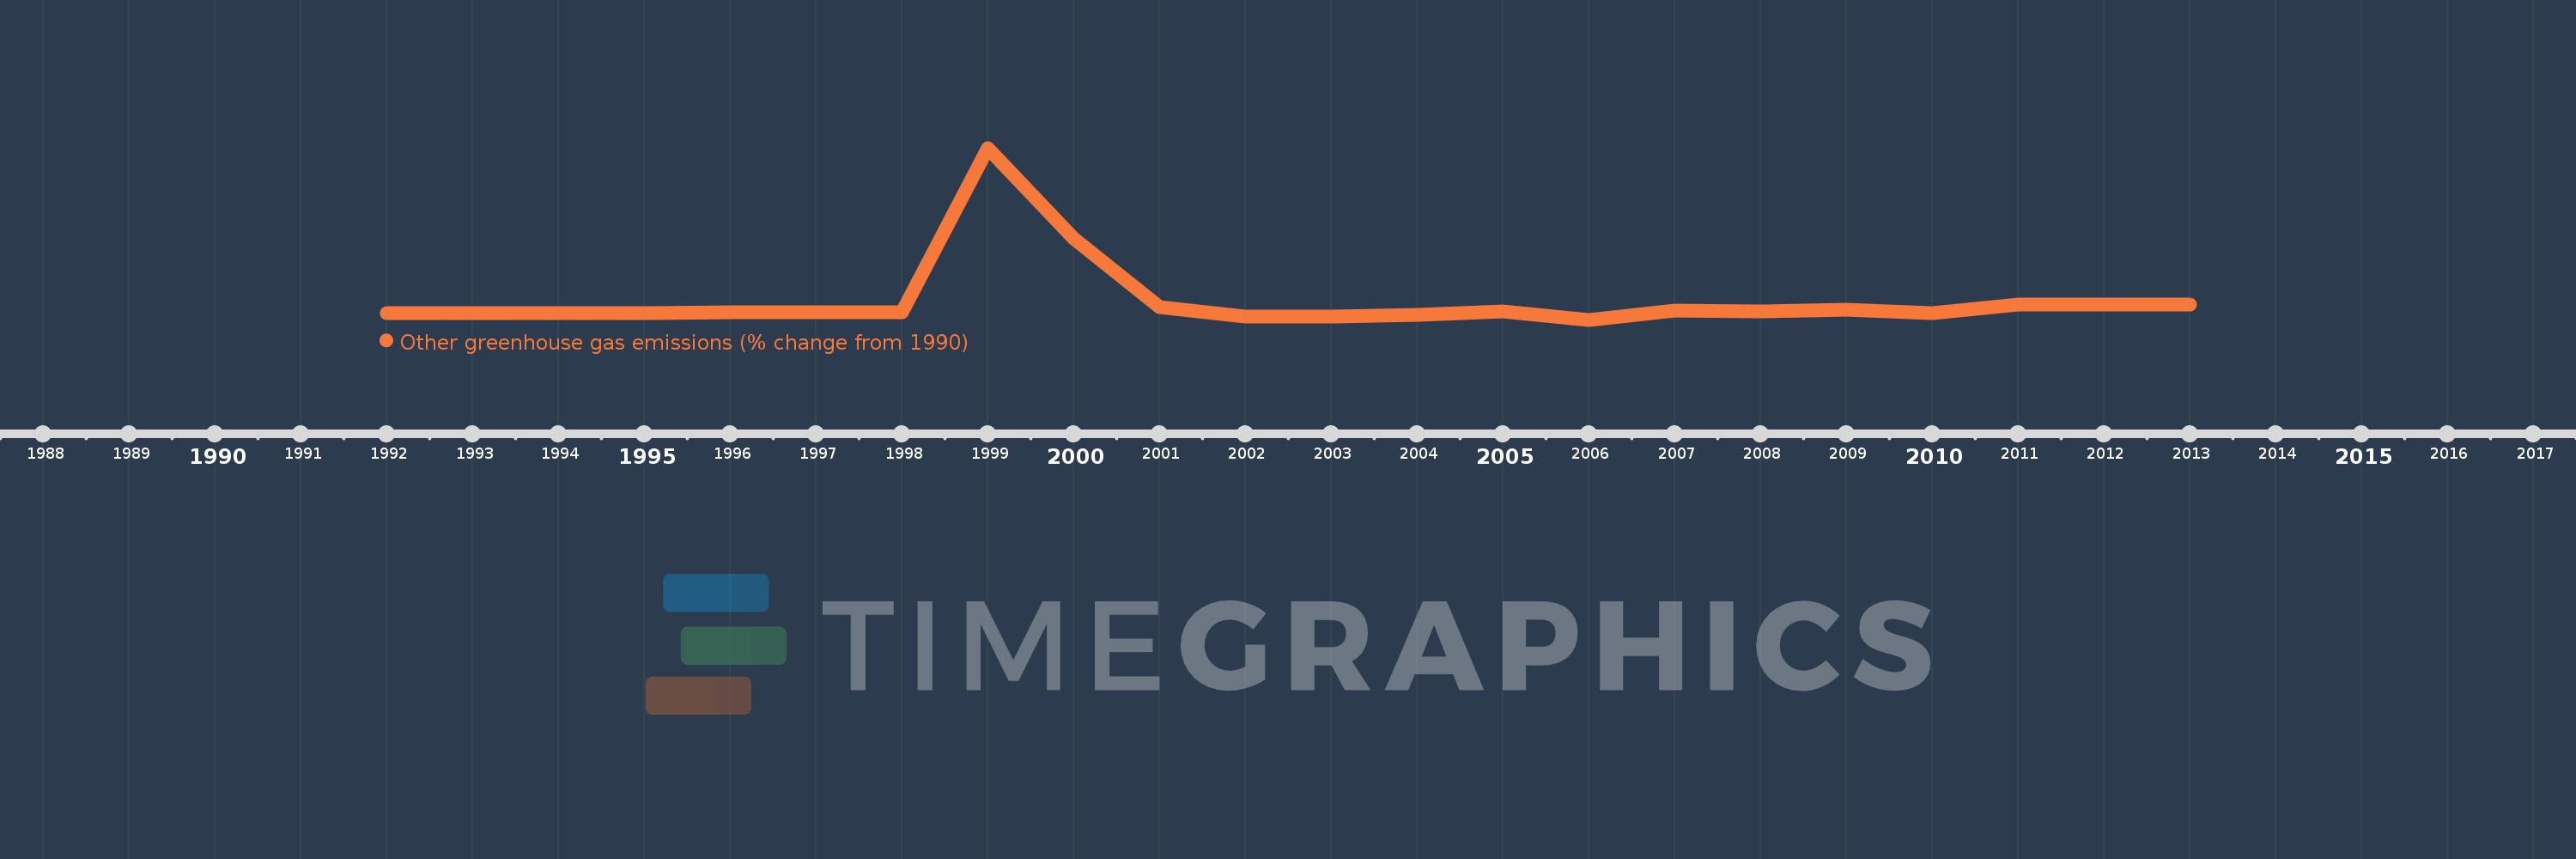
This timeline shows a graph from 1992 to 2013 of Liberia. No data until 1991. Number of actual observations by date: 22.
Source name:
World Development Indicators
Source organization:
World Bank staff estimates from original source: European Commission, Joint Research Centre (JRC)/Netherlands Environmental Assessment Agency (PBL). Emission Database for Global Atmospheric Research (EDGAR): http://edgar.jrc.ec.europa.eu/.
Categories, topics:
Climate Change, Environment
Last updated:
apr 23, 2017
Indicators value changes by year
Meaning:
142.709
Minimum:
-82.527
jan 1, 2006
Maximum:
1.973K
jan 1, 1999
At the date of observation
Value
Absolute change
Change from the previous value
jan 1, 1992
-3.557
-3.557
0.0%
jan 1, 1993
0.648
+4.205
-118.22%
jan 1, 1994
0.462
-0.186
-28.69%
jan 1, 1995
1.576
+1.114
241.05%
jan 1, 1996
5.036
+3.46
219.52%
jan 1, 1997
5.934
+0.898
17.84%
jan 1, 1998
7.623
+1.689
28.46%
jan 1, 1999
1.973K
+1.966K
25.79K%
jan 1, 2000
894.515
-1.079K
-54.67%
jan 1, 2001
65.74
-828.774
-92.65%
jan 1, 2002
-44.58
-110.32
-167.81%
jan 1, 2003
-47.598
-3.018
6.77%
jan 1, 2004
-21.541
+26.057
-54.74%
jan 1, 2005
18.831
+40.372
-187.42%
jan 1, 2006
-82.527
-101.358
-538.25%
jan 1, 2007
24.513
+107.04
-129.7%
jan 1, 2008
16.265
-8.248
-33.65%
jan 1, 2009
36.182
+19.917
122.45%
jan 1, 2010
-2.675
-38.857
-107.39%
jan 1, 2011
97.156
+99.83
-3.73K%
jan 1, 2012
97.156
+0.0
0.0%
jan 1, 2013
97.156
0.0
0.0%
Ranking of countries by current statistics by years
