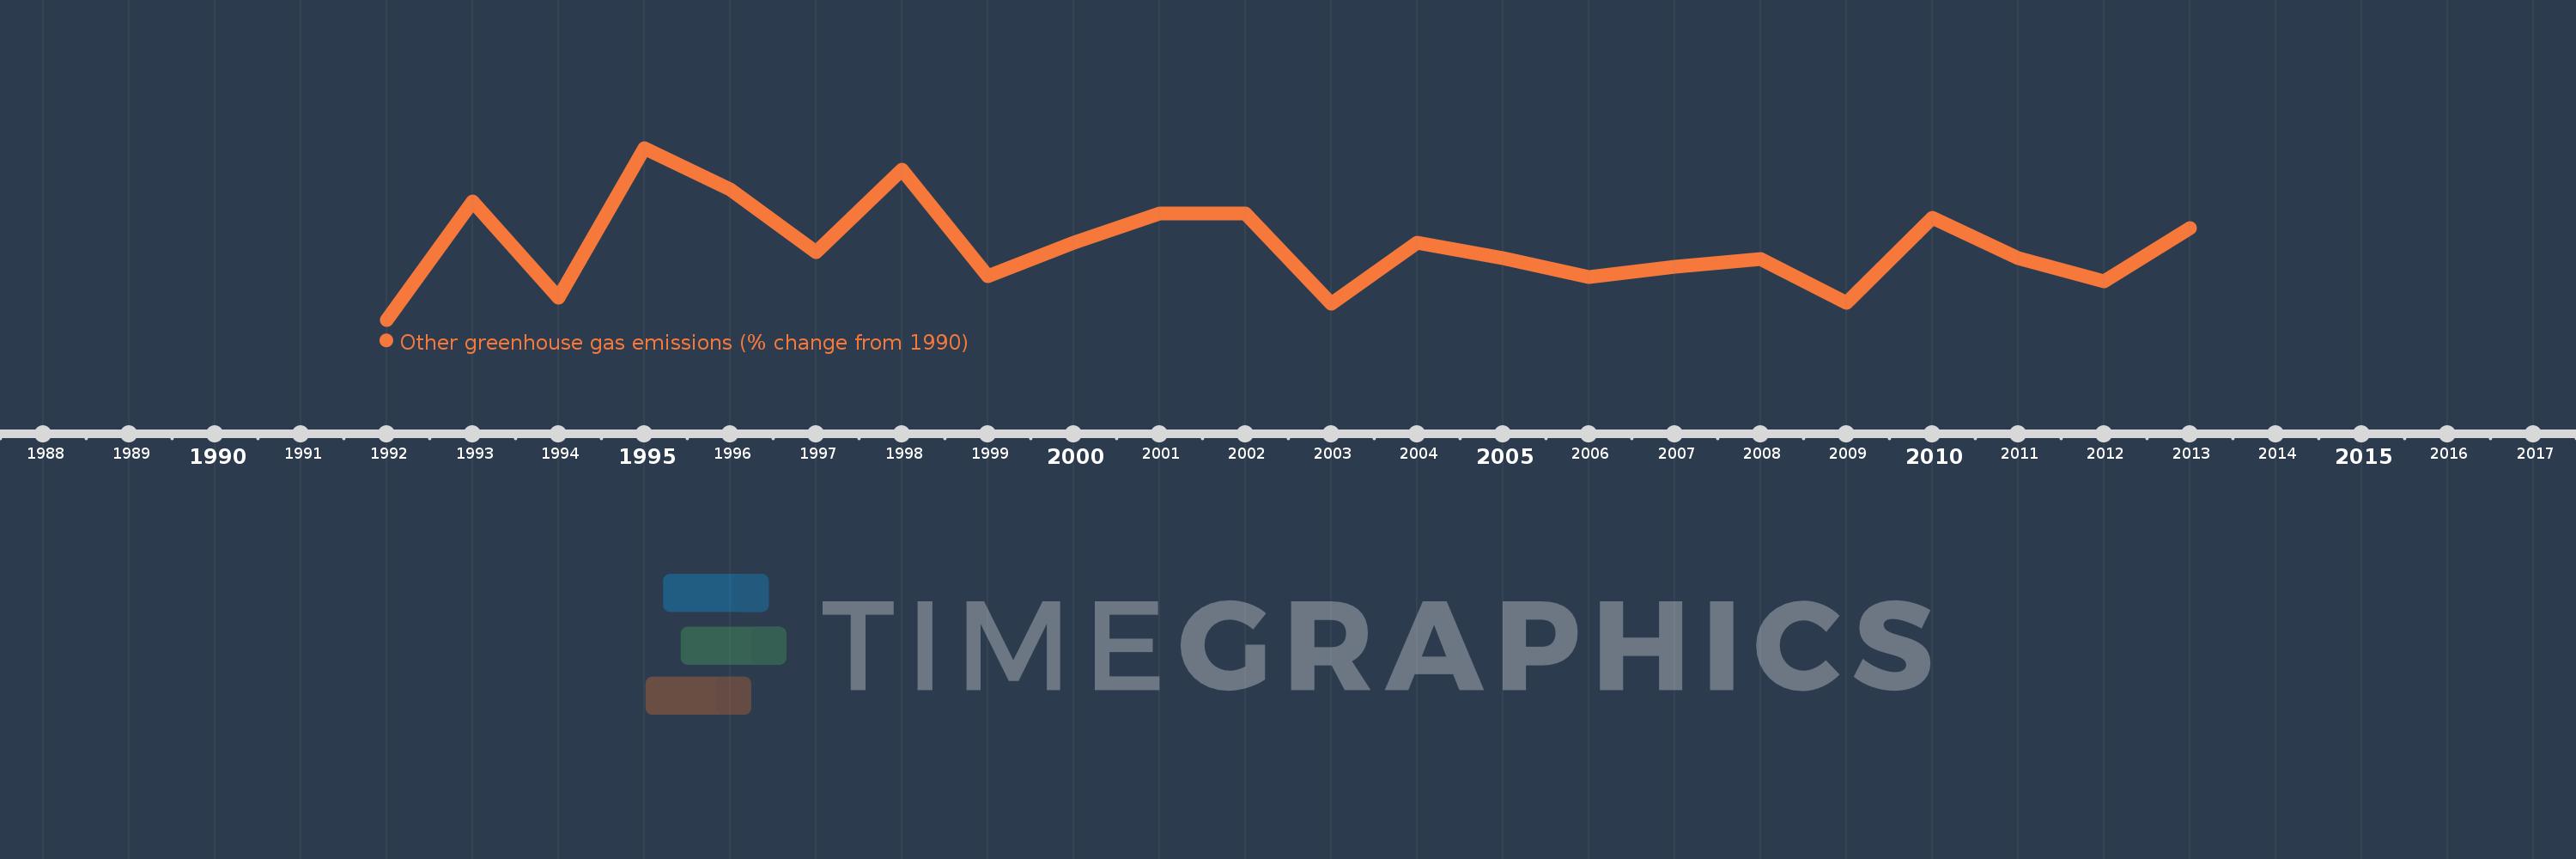
This timeline shows a graph from 1992 to 2013 of Aruba. No data until 1991. Number of actual observations by date: 22.
Source name:
World Development Indicators
Source organization:
World Bank staff estimates from original source: European Commission, Joint Research Centre (JRC)/Netherlands Environmental Assessment Agency (PBL). Emission Database for Global Atmospheric Research (EDGAR): http://edgar.jrc.ec.europa.eu/.
Categories, topics:
Climate Change, Environment
Last updated:
apr 23, 2017
Indicators value changes by year
Meaning:
-96.97
Minimum:
-350.0
jan 1, 1992
Maximum:
241.667
jan 1, 1995
At the date of observation
Value
Absolute change
Change from the previous value
jan 1, 1992
-350.0
-350.0
0.0%
jan 1, 1993
58.333
+408.333
-116.67%
jan 1, 1994
-275.0
-333.333
-571.43%
jan 1, 1995
241.667
+516.667
-187.88%
jan 1, 1996
100.0
-141.667
-58.62%
jan 1, 1997
-116.667
-216.667
-216.67%
jan 1, 1998
166.667
+283.333
-242.86%
jan 1, 1999
-200.0
-366.667
-220.0%
jan 1, 2000
-83.333
+116.667
-58.33%
jan 1, 2001
16.667
+100.0
-120.0%
jan 1, 2002
16.667
0.0
0.0%
jan 1, 2003
-295.833
-312.5
-1.88K%
jan 1, 2004
-83.333
+212.5
-71.83%
jan 1, 2005
-137.5
-54.167
65.0%
jan 1, 2006
-204.167
-66.667
48.48%
jan 1, 2007
-166.667
+37.5
-18.37%
jan 1, 2008
-141.667
+25.0
-15.0%
jan 1, 2009
-291.667
-150.0
105.88%
jan 1, 2010
0.0
+291.667
-100.0%
jan 1, 2011
-137.5
-137.5
%
jan 1, 2012
-216.667
-79.167
57.58%
jan 1, 2013
-33.333
+183.333
-84.62%
Ranking of countries by current statistics by years
