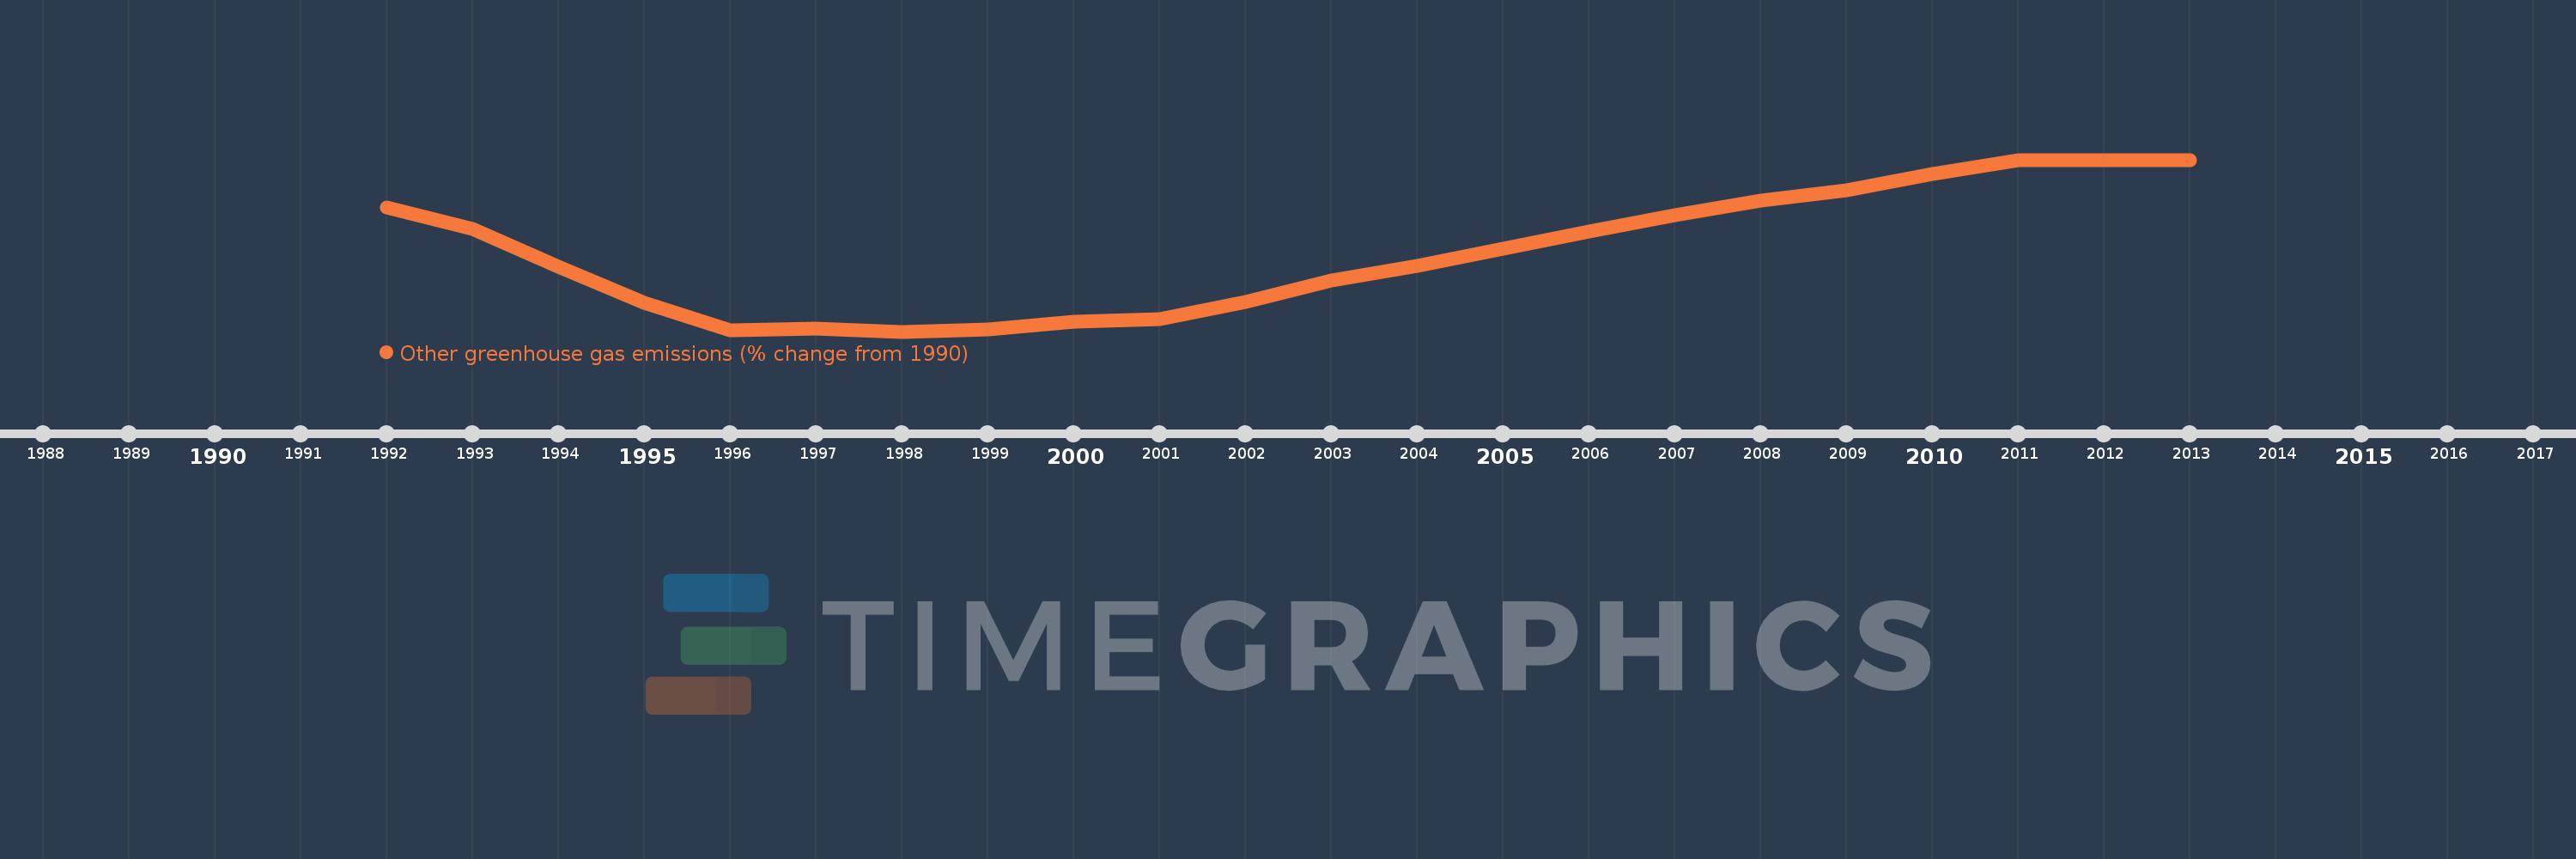
This timeline shows a graph from 1992 to 2013 of Saudi Arabia. No data until 1991. Number of actual observations by date: 22.
Source name:
World Development Indicators
Source organization:
World Bank staff estimates from original source: European Commission, Joint Research Centre (JRC)/Netherlands Environmental Assessment Agency (PBL). Emission Database for Global Atmospheric Research (EDGAR): http://edgar.jrc.ec.europa.eu/.
Categories, topics:
Climate Change, Environment
Last updated:
apr 23, 2017
Indicators value changes by year
Meaning:
-18.303
Minimum:
-49.743
jan 1, 1998
Maximum:
18.481
jan 1, 2013
At the date of observation
Value
Absolute change
Change from the previous value
jan 1, 1992
-0.398
-0.398
0.0%
jan 1, 1993
-8.977
-8.578
2.15K%
jan 1, 1994
-24.022
-15.046
167.61%
jan 1, 1995
-38.171
-14.148
58.9%
jan 1, 1996
-49.3
-11.13
29.16%
jan 1, 1997
-48.452
+0.848
-1.72%
jan 1, 1998
-49.743
-1.291
2.66%
jan 1, 1999
-48.854
+0.889
-1.79%
jan 1, 2000
-45.784
+3.07
-6.28%
jan 1, 2001
-44.735
+1.049
-2.29%
jan 1, 2002
-37.854
+6.881
-15.38%
jan 1, 2003
-29.469
+8.385
-22.15%
jan 1, 2004
-23.567
+5.902
-20.03%
jan 1, 2005
-16.969
+6.598
-28.0%
jan 1, 2006
-9.838
+7.131
-42.02%
jan 1, 2007
-3.609
+6.229
-63.32%
jan 1, 2008
2.129
+5.738
-159.0%
jan 1, 2009
6.514
+4.385
205.98%
jan 1, 2010
12.989
+6.475
99.4%
jan 1, 2011
18.481
+5.492
42.28%
jan 1, 2012
18.481
0.0
0.0%
jan 1, 2013
18.481
+0.0
0.0%
Ranking of countries by current statistics by years
