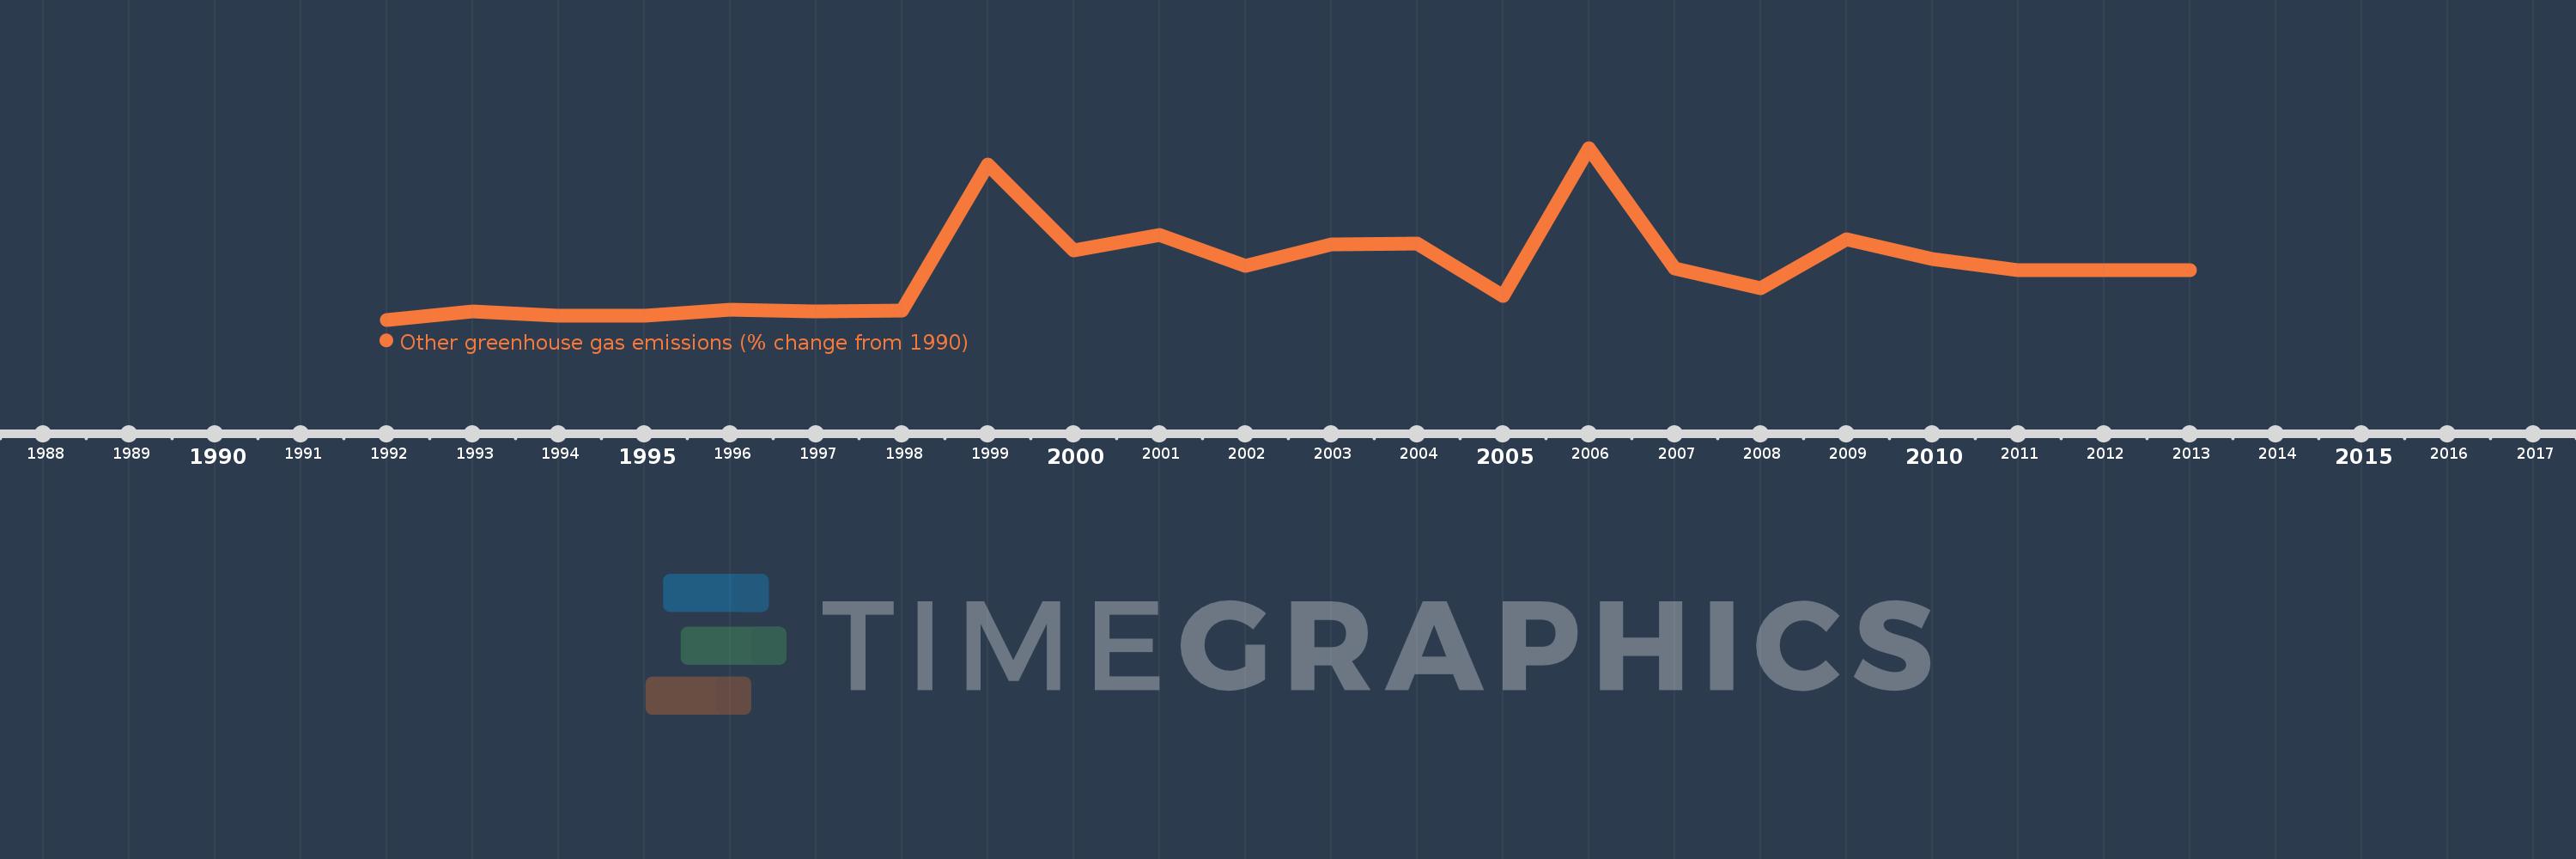
This timeline shows a graph from 1992 to 2013 of Togo. No data until 1991. Number of actual observations by date: 22.
Source name:
World Development Indicators
Source organization:
World Bank staff estimates from original source: European Commission, Joint Research Centre (JRC)/Netherlands Environmental Assessment Agency (PBL). Emission Database for Global Atmospheric Research (EDGAR): http://edgar.jrc.ec.europa.eu/.
Categories, topics:
Climate Change, Environment
Last updated:
apr 23, 2017
Indicators value changes by year
Meaning:
59.265
Minimum:
-19.043
jan 1, 1992
Maximum:
243.476
jan 1, 2006
At the date of observation
Value
Absolute change
Change from the previous value
jan 1, 1992
-19.043
-19.043
0.0%
jan 1, 1993
-6.593
+12.45
-65.38%
jan 1, 1994
-12.798
-6.205
94.12%
jan 1, 1995
-13.138
-0.34
2.66%
jan 1, 1996
-4.034
+9.104
-69.3%
jan 1, 1997
-6.431
-2.398
59.44%
jan 1, 1998
-4.615
+1.816
-28.24%
jan 1, 1999
218.677
+223.292
-4.84K%
jan 1, 2000
86.438
-132.239
-60.47%
jan 1, 2001
110.936
+24.499
28.34%
jan 1, 2002
63.857
-47.08
-42.44%
jan 1, 2003
95.498
+31.641
49.55%
jan 1, 2004
97.141
+1.643
1.72%
jan 1, 2005
17.434
-79.707
-82.05%
jan 1, 2006
243.476
+226.041
1.3K%
jan 1, 2007
59.78
-183.696
-75.45%
jan 1, 2008
28.652
-31.128
-52.07%
jan 1, 2009
103.402
+74.749
260.89%
jan 1, 2010
73.143
-30.258
-29.26%
jan 1, 2011
57.349
-15.795
-21.59%
jan 1, 2012
57.349
0.0
0.0%
jan 1, 2013
57.349
0.0
0.0%
Ranking of countries by current statistics by years
