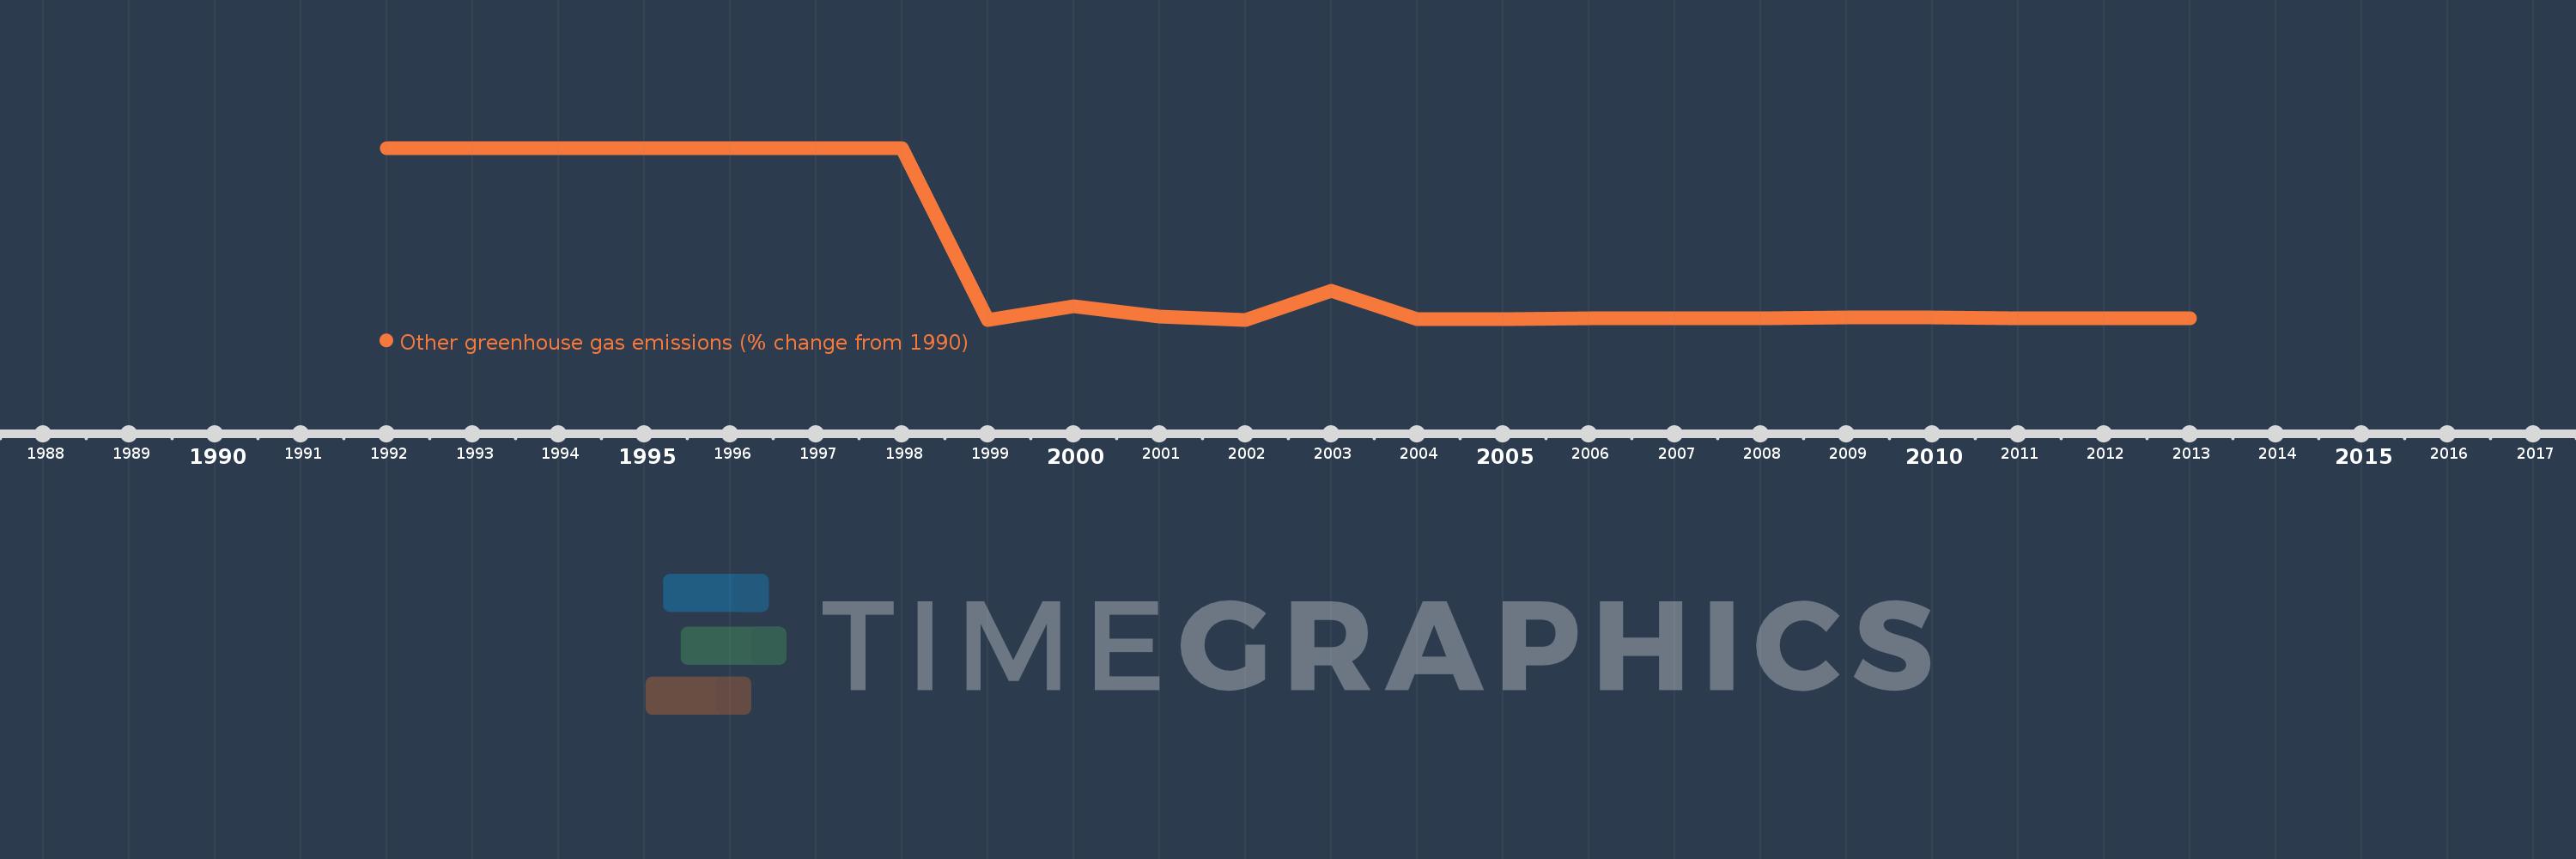
This timeline shows a graph from 1992 to 2013 of Belarus. No data until 1991. Number of actual observations by date: 22.
Source name:
World Development Indicators
Source organization:
World Bank staff estimates from original source: European Commission, Joint Research Centre (JRC)/Netherlands Environmental Assessment Agency (PBL). Emission Database for Global Atmospheric Research (EDGAR): http://edgar.jrc.ec.europa.eu/.
Categories, topics:
Climate Change, Environment
Last updated:
apr 23, 2017
Indicators value changes by year
Meaning:
-66.235
Minimum:
-99.559
jan 1, 1999
Maximum:
0.125
jan 1, 1998
At the date of observation
Value
Absolute change
Change from the previous value
jan 1, 1992
0.001
+0.001
0.0%
jan 1, 1993
0.004
+0.003
227.04%
jan 1, 1994
0.011
+0.008
208.66%
jan 1, 1995
0.022
+0.01
88.45%
jan 1, 1996
0.047
+0.025
116.78%
jan 1, 1997
0.081
+0.034
73.25%
jan 1, 1998
0.125
+0.044
54.45%
jan 1, 1999
-99.559
-99.685
-79.73K%
jan 1, 2000
-91.687
+7.872
-7.91%
jan 1, 2001
-97.56
-5.873
6.41%
jan 1, 2002
-99.512
-1.952
2.0%
jan 1, 2003
-82.763
+16.749
-16.83%
jan 1, 2004
-99.064
-16.301
19.7%
jan 1, 2005
-99.029
+0.035
-0.04%
jan 1, 2006
-98.817
+0.212
-0.21%
jan 1, 2007
-98.524
+0.293
-0.3%
jan 1, 2008
-98.588
-0.064
0.07%
jan 1, 2009
-98.365
+0.223
-0.23%
jan 1, 2010
-97.992
+0.373
-0.38%
jan 1, 2011
-98.668
-0.676
0.69%
jan 1, 2012
-98.668
0.0
0.0%
jan 1, 2013
-98.668
0.0
0.0%
Ranking of countries by current statistics by years
