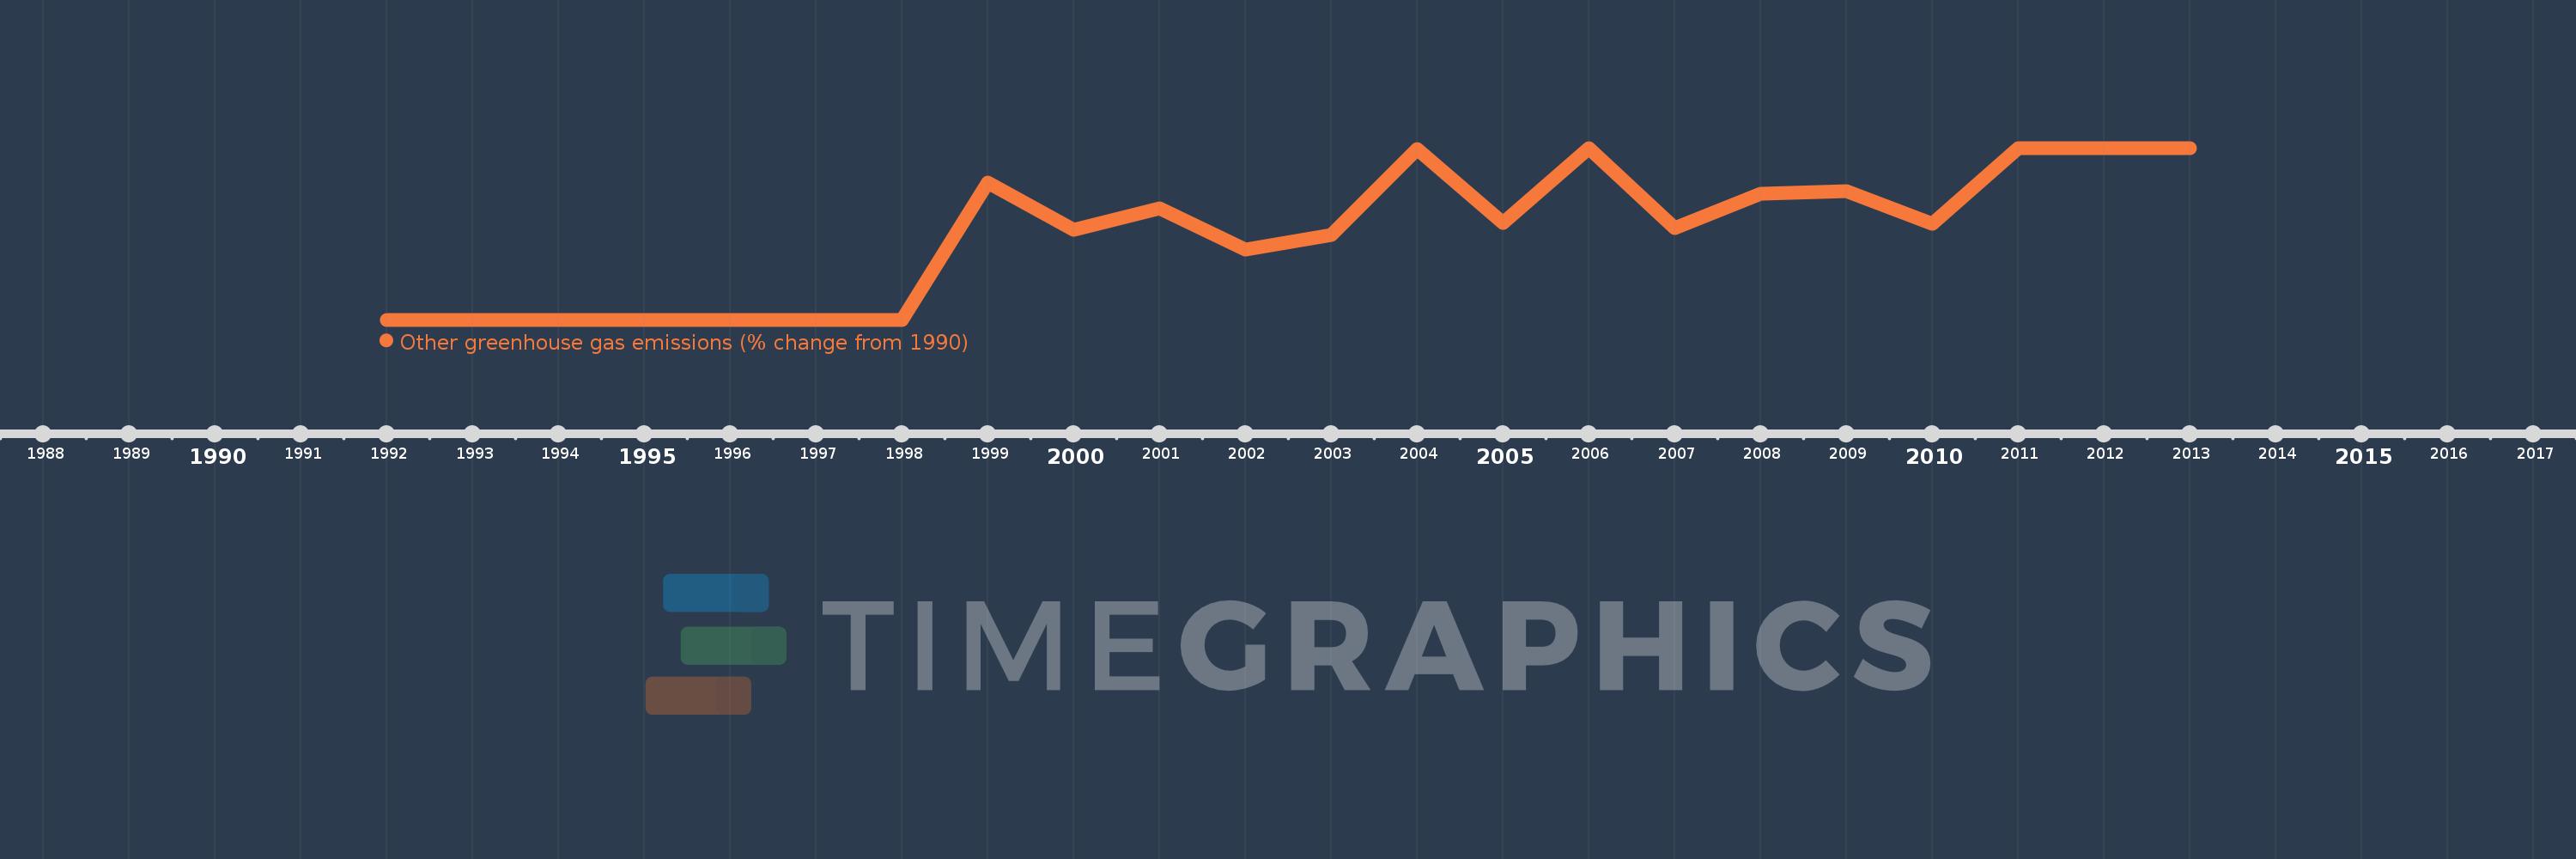
This timeline shows a graph from 1992 to 2013 of Malawi. No data until 1991. Number of actual observations by date: 22.
Source name:
World Development Indicators
Source organization:
World Bank staff estimates from original source: European Commission, Joint Research Centre (JRC)/Netherlands Environmental Assessment Agency (PBL). Emission Database for Global Atmospheric Research (EDGAR): http://edgar.jrc.ec.europa.eu/.
Categories, topics:
Climate Change, Environment
Last updated:
apr 23, 2017
Indicators value changes by year
Meaning:
486.613
Minimum:
0.0
jan 1, 1992
Maximum:
973.033
jan 1, 2006
At the date of observation
Value
Absolute change
Change from the previous value
jan 1, 1992
0.0
0.0
0.0%
jan 1, 1993
0.0
0.0
%
jan 1, 1994
0.0
0.0
%
jan 1, 1995
0.0
0.0
%
jan 1, 1996
0.0
0.0
%
jan 1, 1997
0.0
0.0
%
jan 1, 1998
0.0
0.0
%
jan 1, 1999
774.742
+774.742
%
jan 1, 2000
509.194
-265.548
-34.28%
jan 1, 2001
633.217
+124.023
24.36%
jan 1, 2002
395.272
-237.944
-37.58%
jan 1, 2003
481.452
+86.18
21.8%
jan 1, 2004
968.917
+487.464
101.25%
jan 1, 2005
549.518
-419.398
-43.29%
jan 1, 2006
973.033
+423.515
77.07%
jan 1, 2007
517.898
-455.136
-46.77%
jan 1, 2008
714.018
+196.121
37.87%
jan 1, 2009
727.376
+13.358
1.87%
jan 1, 2010
543.663
-183.713
-25.26%
jan 1, 2011
972.392
+428.729
78.86%
jan 1, 2012
972.392
0.0
0.0%
jan 1, 2013
972.392
0.0
0.0%
Ranking of countries by current statistics by years
