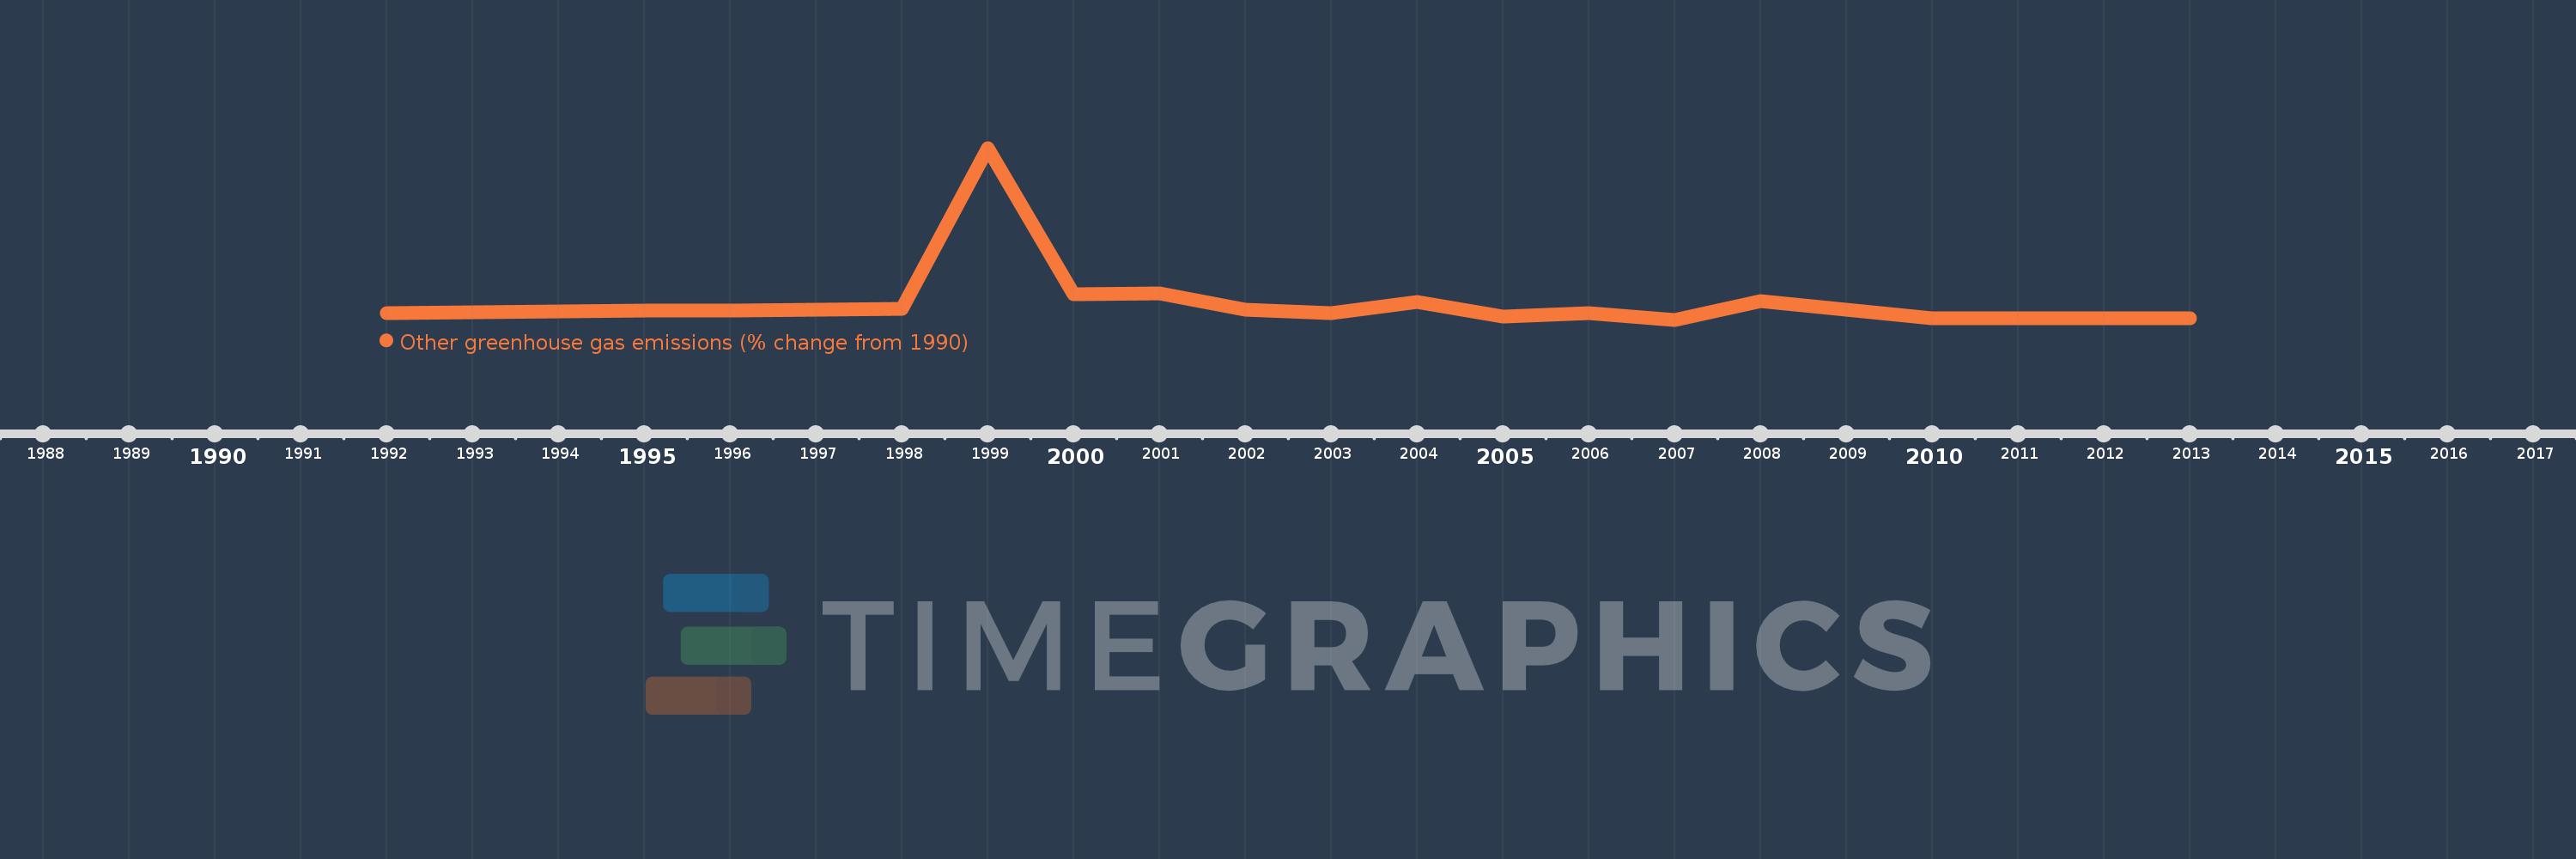
This timeline shows a graph from 1992 to 2013 of Kenya. No data until 1991. Number of actual observations by date: 22.
Source name:
World Development Indicators
Source organization:
World Bank staff estimates from original source: European Commission, Joint Research Centre (JRC)/Netherlands Environmental Assessment Agency (PBL). Emission Database for Global Atmospheric Research (EDGAR): http://edgar.jrc.ec.europa.eu/.
Categories, topics:
Climate Change, Environment
Last updated:
apr 23, 2017
Indicators value changes by year
Meaning:
78.931
Minimum:
-42.065
jan 1, 2007
Maximum:
1.209K
jan 1, 1999
At the date of observation
Value
Absolute change
Change from the previous value
jan 1, 1992
5.556
+5.556
0.0%
jan 1, 1993
11.111
+5.556
100.0%
jan 1, 1994
16.666
+5.555
50.0%
jan 1, 1995
22.222
+5.556
33.33%
jan 1, 1996
27.778
+5.556
25.0%
jan 1, 1997
33.334
+5.556
20.0%
jan 1, 1998
38.889
+5.556
16.67%
jan 1, 1999
1.209K
+1.17K
3.01K%
jan 1, 2000
140.967
-1.068K
-88.34%
jan 1, 2001
151.61
+10.643
7.55%
jan 1, 2002
33.642
-117.968
-77.81%
jan 1, 2003
9.21
-24.432
-72.62%
jan 1, 2004
85.317
+76.107
826.35%
jan 1, 2005
-18.925
-104.242
-122.18%
jan 1, 2006
7.09
+26.015
-137.47%
jan 1, 2007
-42.065
-49.155
-693.26%
jan 1, 2008
95.501
+137.566
-327.03%
jan 1, 2009
28.456
-67.044
-70.2%
jan 1, 2010
-30.096
-58.552
-205.76%
jan 1, 2011
-29.573
+0.523
-1.74%
jan 1, 2012
-29.573
0.0
0.0%
jan 1, 2013
-29.573
0.0
0.0%
Ranking of countries by current statistics by years
