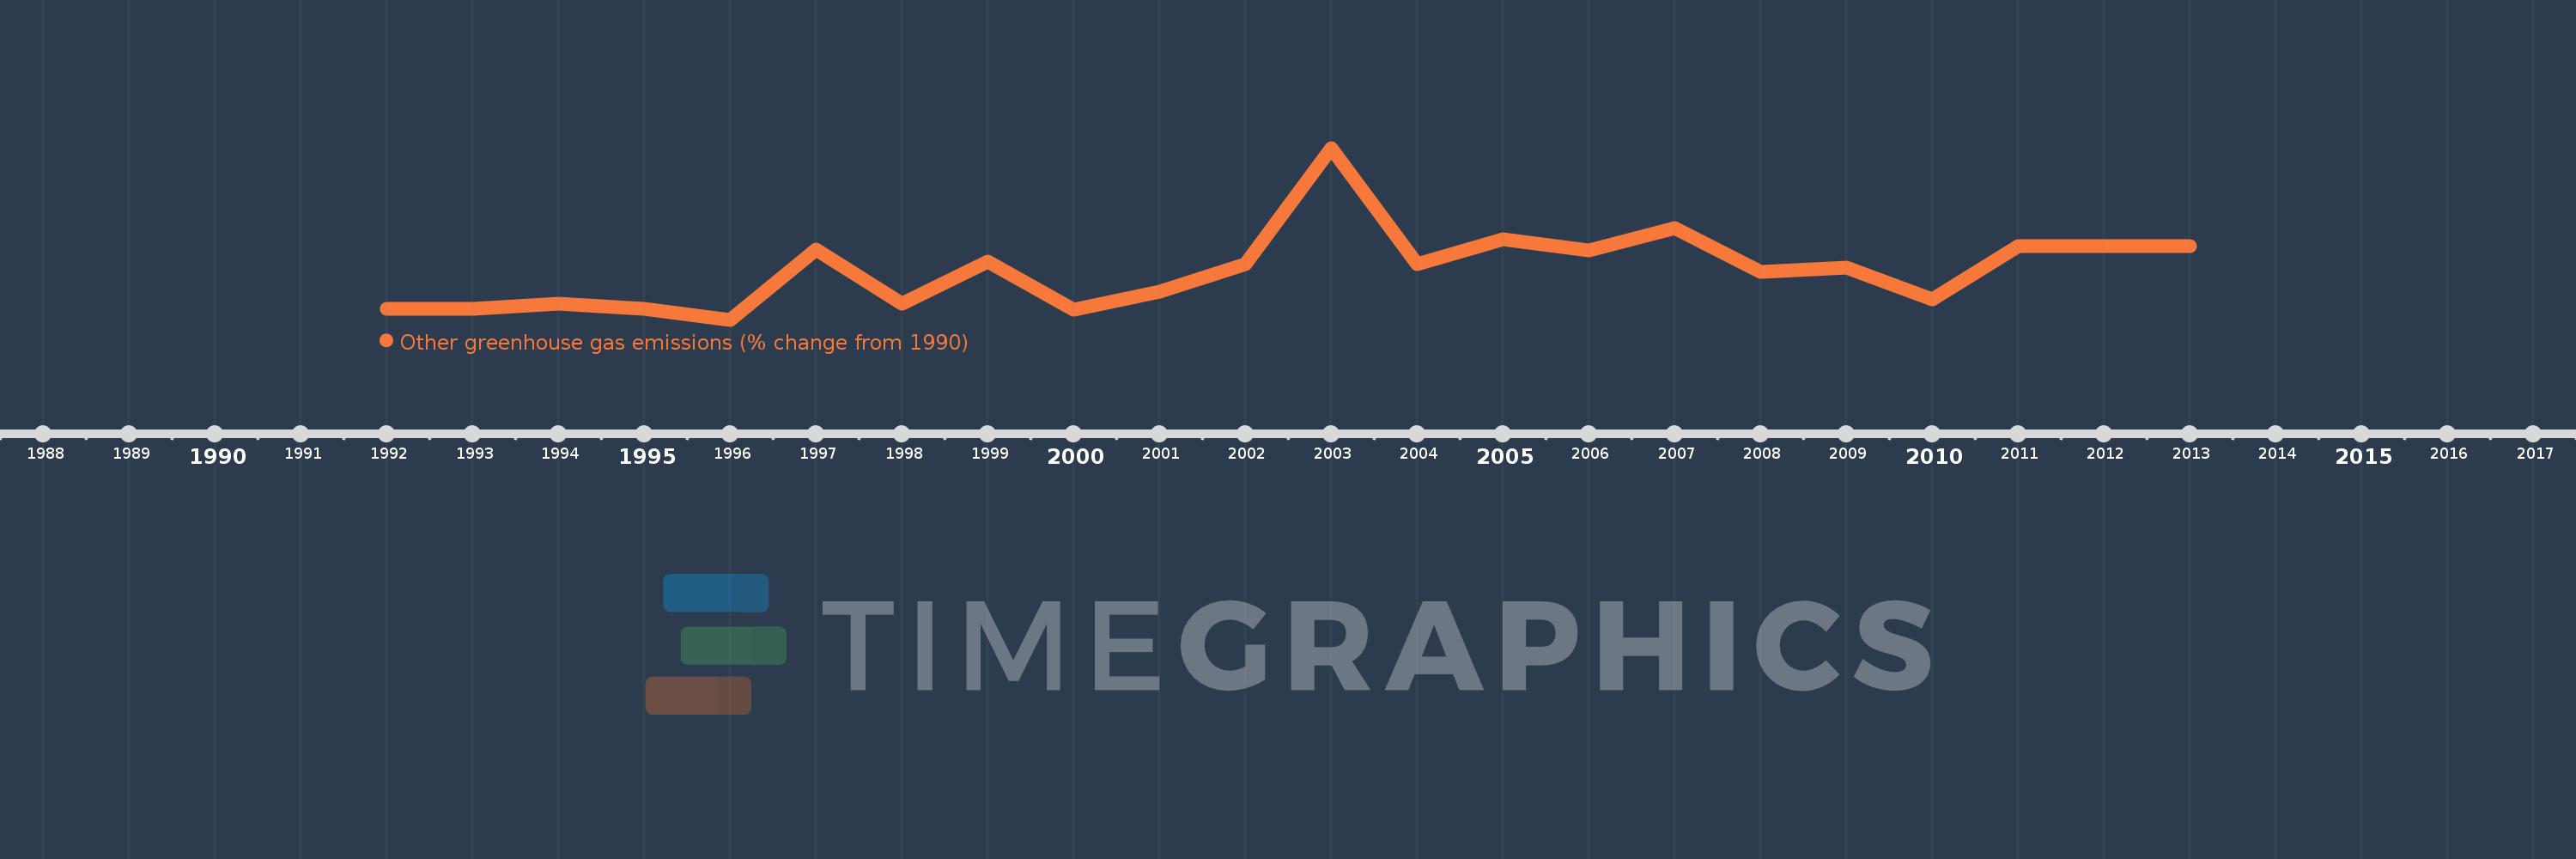
This timeline shows a graph from 1992 to 2013 of Kazakhstan. No data until 1991. Number of actual observations by date: 22.
Source name:
World Development Indicators
Source organization:
World Bank staff estimates from original source: European Commission, Joint Research Centre (JRC)/Netherlands Environmental Assessment Agency (PBL). Emission Database for Global Atmospheric Research (EDGAR): http://edgar.jrc.ec.europa.eu/.
Categories, topics:
Climate Change, Environment
Last updated:
apr 23, 2017
Indicators value changes by year
Meaning:
39.889
Minimum:
-74.783
jan 1, 1996
Maximum:
320.321
jan 1, 2003
At the date of observation
Value
Absolute change
Change from the previous value
jan 1, 1992
-49.902
-49.902
0.0%
jan 1, 1993
-49.898
+0.004
-0.01%
jan 1, 1994
-37.407
+12.491
-25.03%
jan 1, 1995
-49.863
-12.456
33.3%
jan 1, 1996
-74.783
-24.92
49.98%
jan 1, 1997
87.452
+162.235
-216.94%
jan 1, 1998
-37.275
-124.727
-142.62%
jan 1, 1999
59.409
+96.684
-259.38%
jan 1, 2000
-50.97
-110.379
-185.79%
jan 1, 2001
-10.175
+40.794
-80.04%
jan 1, 2002
52.967
+63.142
-620.55%
jan 1, 2003
320.321
+267.354
504.76%
jan 1, 2004
52.135
-268.186
-83.72%
jan 1, 2005
109.484
+57.35
110.0%
jan 1, 2006
84.928
-24.556
-22.43%
jan 1, 2007
136.481
+51.553
60.7%
jan 1, 2008
35.491
-100.99
-74.0%
jan 1, 2009
45.775
+10.284
28.98%
jan 1, 2010
-28.369
-74.144
-161.97%
jan 1, 2011
93.918
+122.286
-431.06%
jan 1, 2012
93.918
0.0
0.0%
jan 1, 2013
93.918
0.0
0.0%
Ranking of countries by current statistics by years
