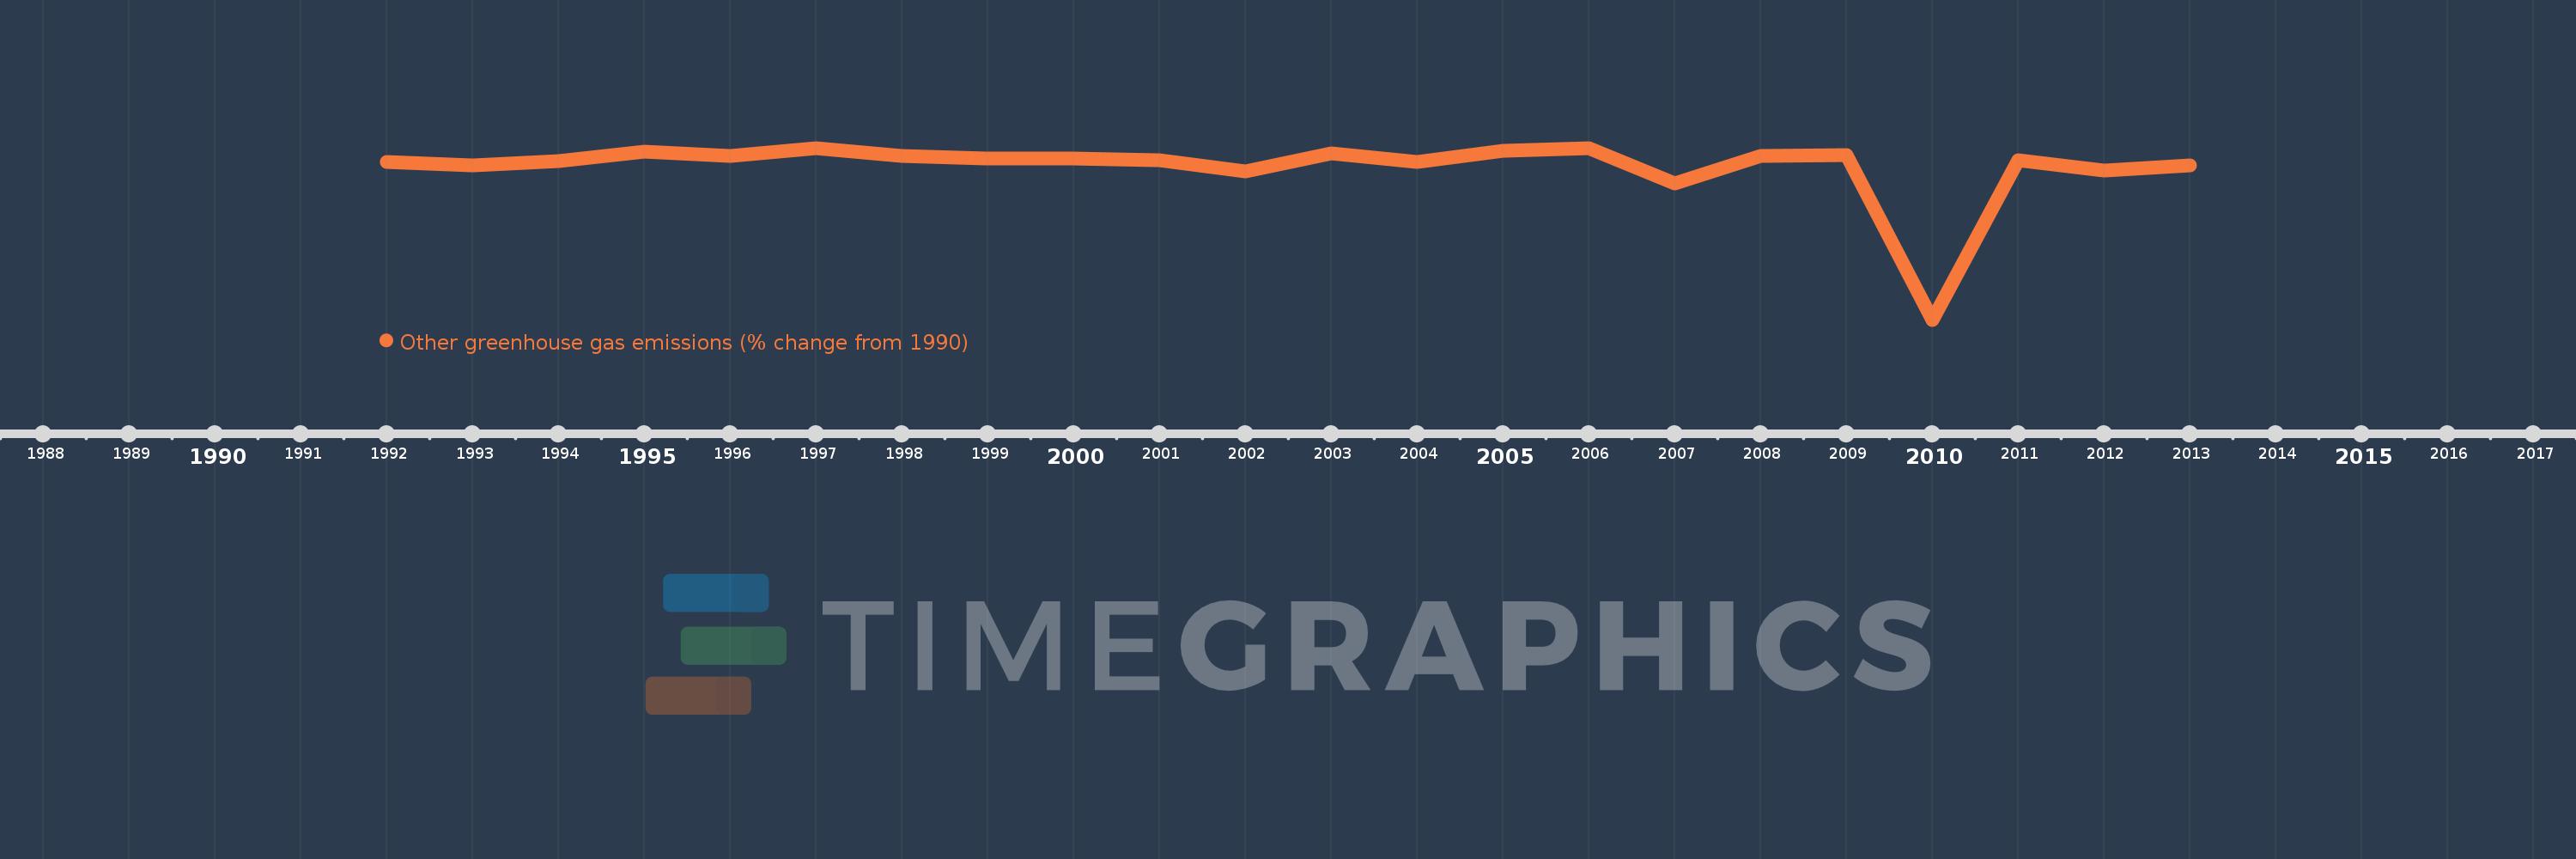
This timeline shows a graph from 1992 to 2013 of Nauru. No data until 1991. Number of actual observations by date: 22.
Source name:
World Development Indicators
Source organization:
World Bank staff estimates from original source: European Commission, Joint Research Centre (JRC)/Netherlands Environmental Assessment Agency (PBL). Emission Database for Global Atmospheric Research (EDGAR): http://edgar.jrc.ec.europa.eu/.
Categories, topics:
Climate Change, Environment
Last updated:
apr 23, 2017
Indicators value changes by year
Meaning:
-268.182
Minimum:
-2.325K
jan 1, 2010
Maximum:
-12.5
jan 1, 1997
At the date of observation
Value
Absolute change
Change from the previous value
jan 1, 1992
-200.0
-200.0
0.0%
jan 1, 1993
-250.0
-50.0
25.0%
jan 1, 1994
-187.5
+62.5
-25.0%
jan 1, 1995
-62.5
+125.0
-66.67%
jan 1, 1996
-125.0
-62.5
100.0%
jan 1, 1997
-12.5
+112.5
-90.0%
jan 1, 1998
-125.0
-112.5
900.0%
jan 1, 1999
-150.0
-25.0
20.0%
jan 1, 2000
-150.0
0.0
0.0%
jan 1, 2001
-175.0
-25.0
16.67%
jan 1, 2002
-325.0
-150.0
85.71%
jan 1, 2003
-87.5
+237.5
-73.08%
jan 1, 2004
-200.0
-112.5
128.57%
jan 1, 2005
-50.0
+150.0
-75.0%
jan 1, 2006
-12.5
+37.5
-75.0%
jan 1, 2007
-487.5
-475.0
3.8K%
jan 1, 2008
-125.0
+362.5
-74.36%
jan 1, 2009
-112.5
+12.5
-10.0%
jan 1, 2010
-2.325K
-2.212K
1.97K%
jan 1, 2011
-175.0
+2.15K
-92.47%
jan 1, 2012
-312.5
-137.5
78.57%
jan 1, 2013
-250.0
+62.5
-20.0%
Ranking of countries by current statistics by years
