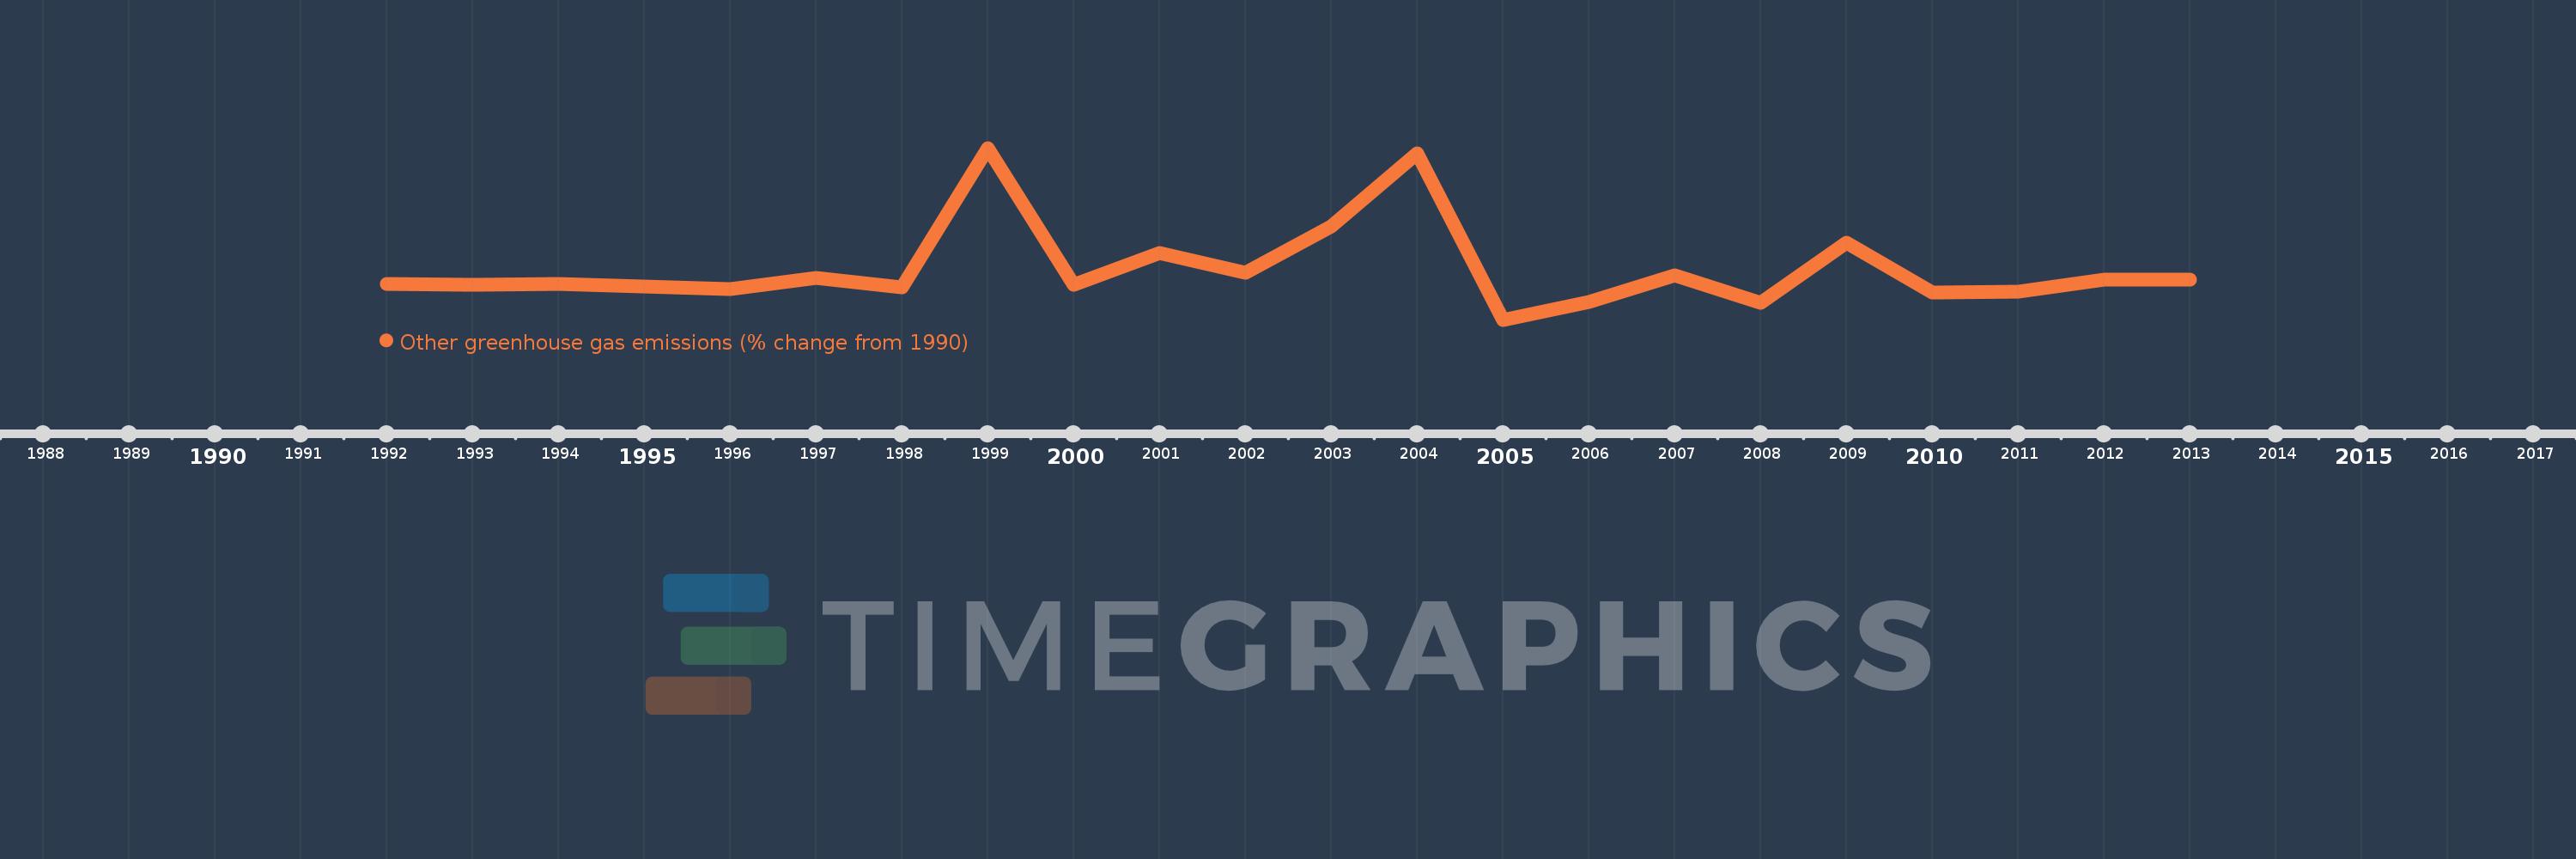
This timeline shows a graph from 1992 to 2013 of Russian Federation. No data until 1991. Number of actual observations by date: 22.
Source name:
World Development Indicators
Source organization:
World Bank staff estimates from original source: European Commission, Joint Research Centre (JRC)/Netherlands Environmental Assessment Agency (PBL). Emission Database for Global Atmospheric Research (EDGAR): http://edgar.jrc.ec.europa.eu/.
Categories, topics:
Climate Change, Environment
Last updated:
apr 23, 2017
Indicators value changes by year
Meaning:
20.752
Minimum:
-68.789
jan 1, 2005
Maximum:
234.614
jan 1, 1999
At the date of observation
Value
Absolute change
Change from the previous value
jan 1, 1992
-5.72
-5.72
0.0%
jan 1, 1993
-6.897
-1.177
20.57%
jan 1, 1994
-6.053
+0.844
-12.23%
jan 1, 1995
-9.684
-3.631
59.99%
jan 1, 1996
-14.065
-4.381
45.24%
jan 1, 1997
5.48
+19.545
-138.96%
jan 1, 1998
-12.135
-17.615
-321.44%
jan 1, 1999
234.614
+246.75
-2.03K%
jan 1, 2000
-7.454
-242.068
-103.18%
jan 1, 2001
48.873
+56.326
-755.69%
jan 1, 2002
13.689
-35.183
-71.99%
jan 1, 2003
96.809
+83.119
607.18%
jan 1, 2004
224.782
+127.974
132.19%
jan 1, 2005
-68.789
-293.572
-130.6%
jan 1, 2006
-37.043
+31.747
-46.15%
jan 1, 2007
9.58
+46.623
-125.86%
jan 1, 2008
-39.582
-49.162
-513.17%
jan 1, 2009
67.83
+107.412
-271.37%
jan 1, 2010
-21.101
-88.931
-131.11%
jan 1, 2011
-19.686
+1.415
-6.71%
jan 1, 2012
1.549
+21.235
-107.87%
jan 1, 2013
1.549
0.0
0.0%
Ranking of countries by current statistics by years
