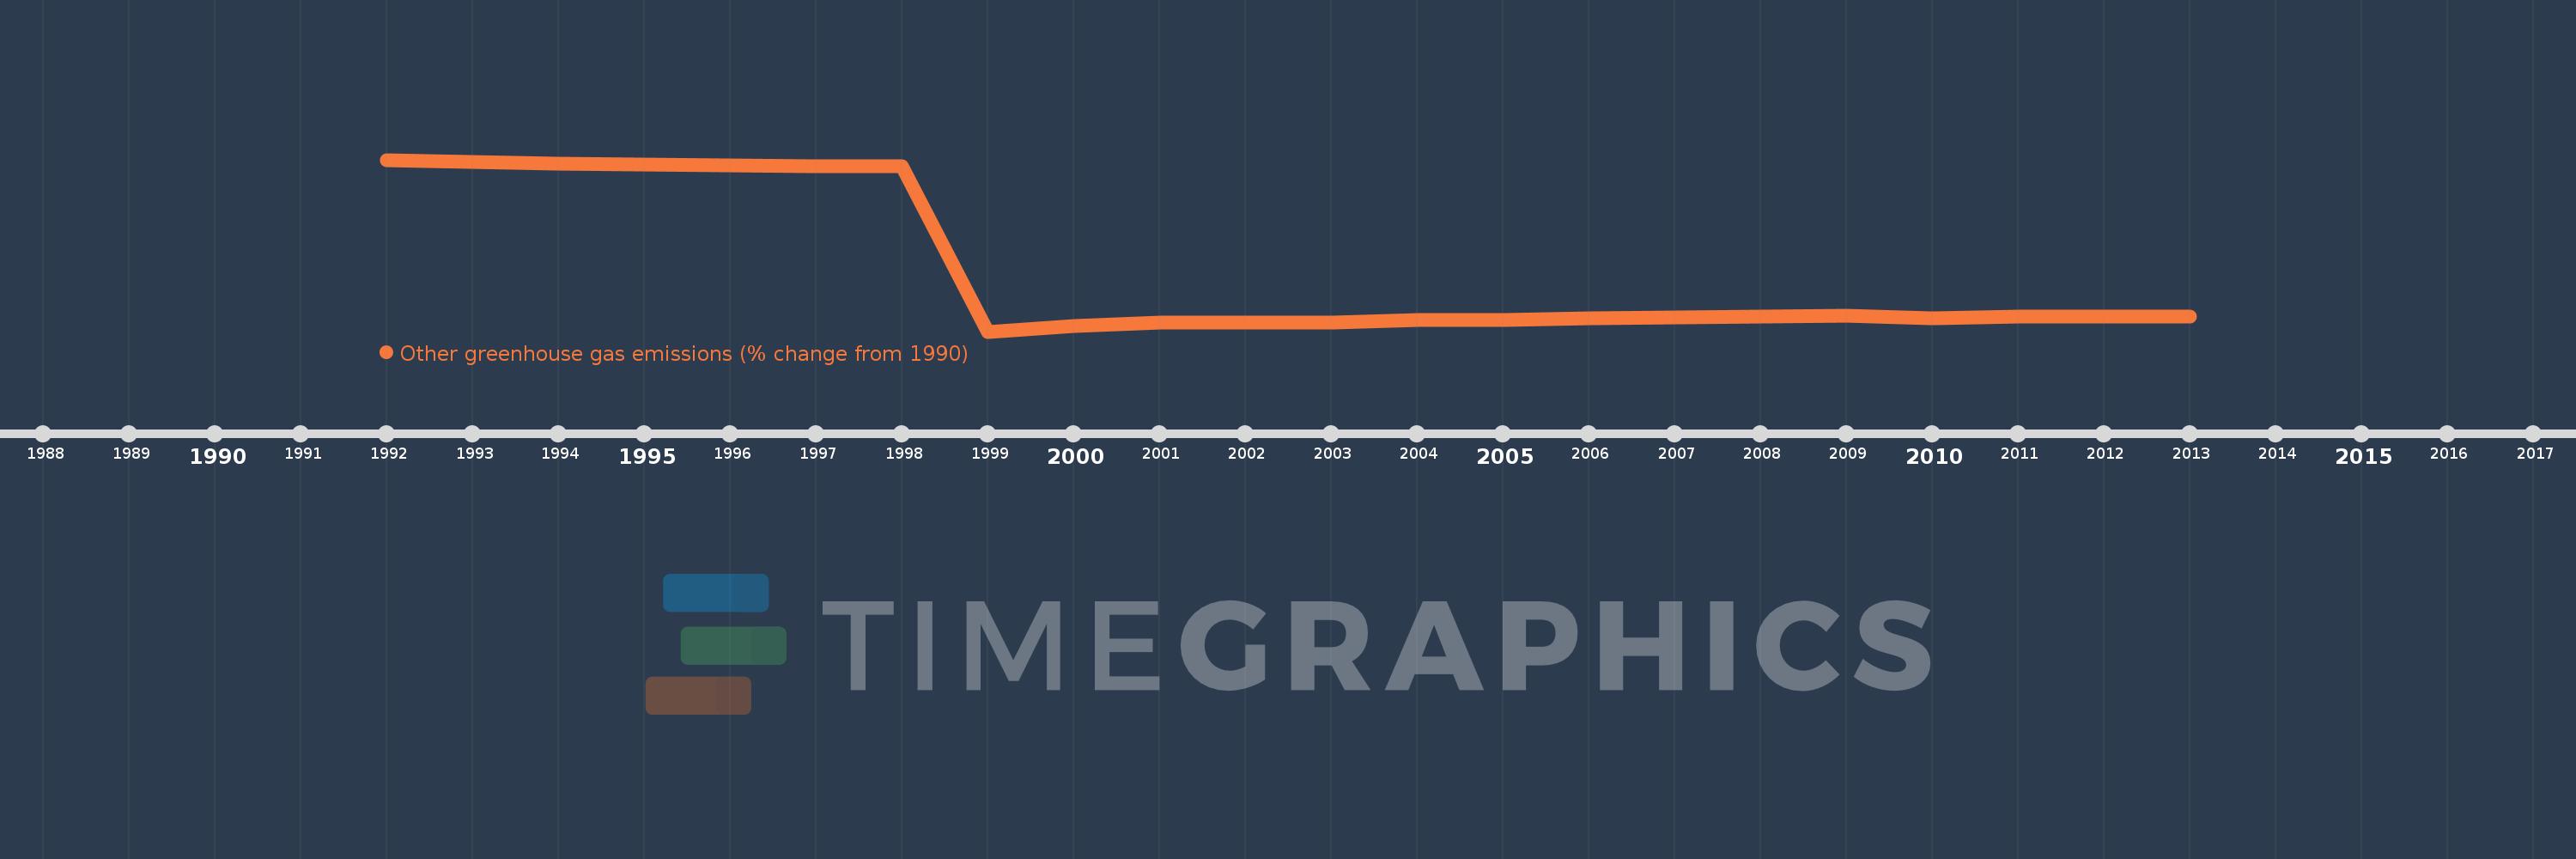
This timeline shows a graph from 1992 to 2013 of Ireland. No data until 1991. Number of actual observations by date: 22.
Source name:
World Development Indicators
Source organization:
World Bank staff estimates from original source: European Commission, Joint Research Centre (JRC)/Netherlands Environmental Assessment Agency (PBL). Emission Database for Global Atmospheric Research (EDGAR): http://edgar.jrc.ec.europa.eu/.
Categories, topics:
Climate Change, Environment
Last updated:
apr 23, 2017
Indicators value changes by year
Meaning:
-62.339
Minimum:
-96.262
jan 1, 1999
Maximum:
-1.062
jan 1, 1992
At the date of observation
Value
Absolute change
Change from the previous value
jan 1, 1992
-1.062
-1.062
0.0%
jan 1, 1993
-2.054
-0.992
93.43%
jan 1, 1994
-2.992
-0.938
45.67%
jan 1, 1995
-3.779
-0.787
26.28%
jan 1, 1996
-4.158
-0.379
10.03%
jan 1, 1997
-4.492
-0.334
8.04%
jan 1, 1998
-4.762
-0.269
6.0%
jan 1, 1999
-96.262
-91.5
1.92K%
jan 1, 2000
-93.384
+2.878
-2.99%
jan 1, 2001
-91.288
+2.096
-2.24%
jan 1, 2002
-91.042
+0.246
-0.27%
jan 1, 2003
-91.275
-0.234
0.26%
jan 1, 2004
-89.913
+1.363
-1.49%
jan 1, 2005
-89.925
-0.012
0.01%
jan 1, 2006
-89.043
+0.882
-0.98%
jan 1, 2007
-88.501
+0.541
-0.61%
jan 1, 2008
-87.877
+0.624
-0.71%
jan 1, 2009
-87.465
+0.412
-0.47%
jan 1, 2010
-88.941
-1.476
1.69%
jan 1, 2011
-87.746
+1.195
-1.34%
jan 1, 2012
-87.746
0.0
0.0%
jan 1, 2013
-87.746
+0.0
0.0%
Ranking of countries by current statistics by years
