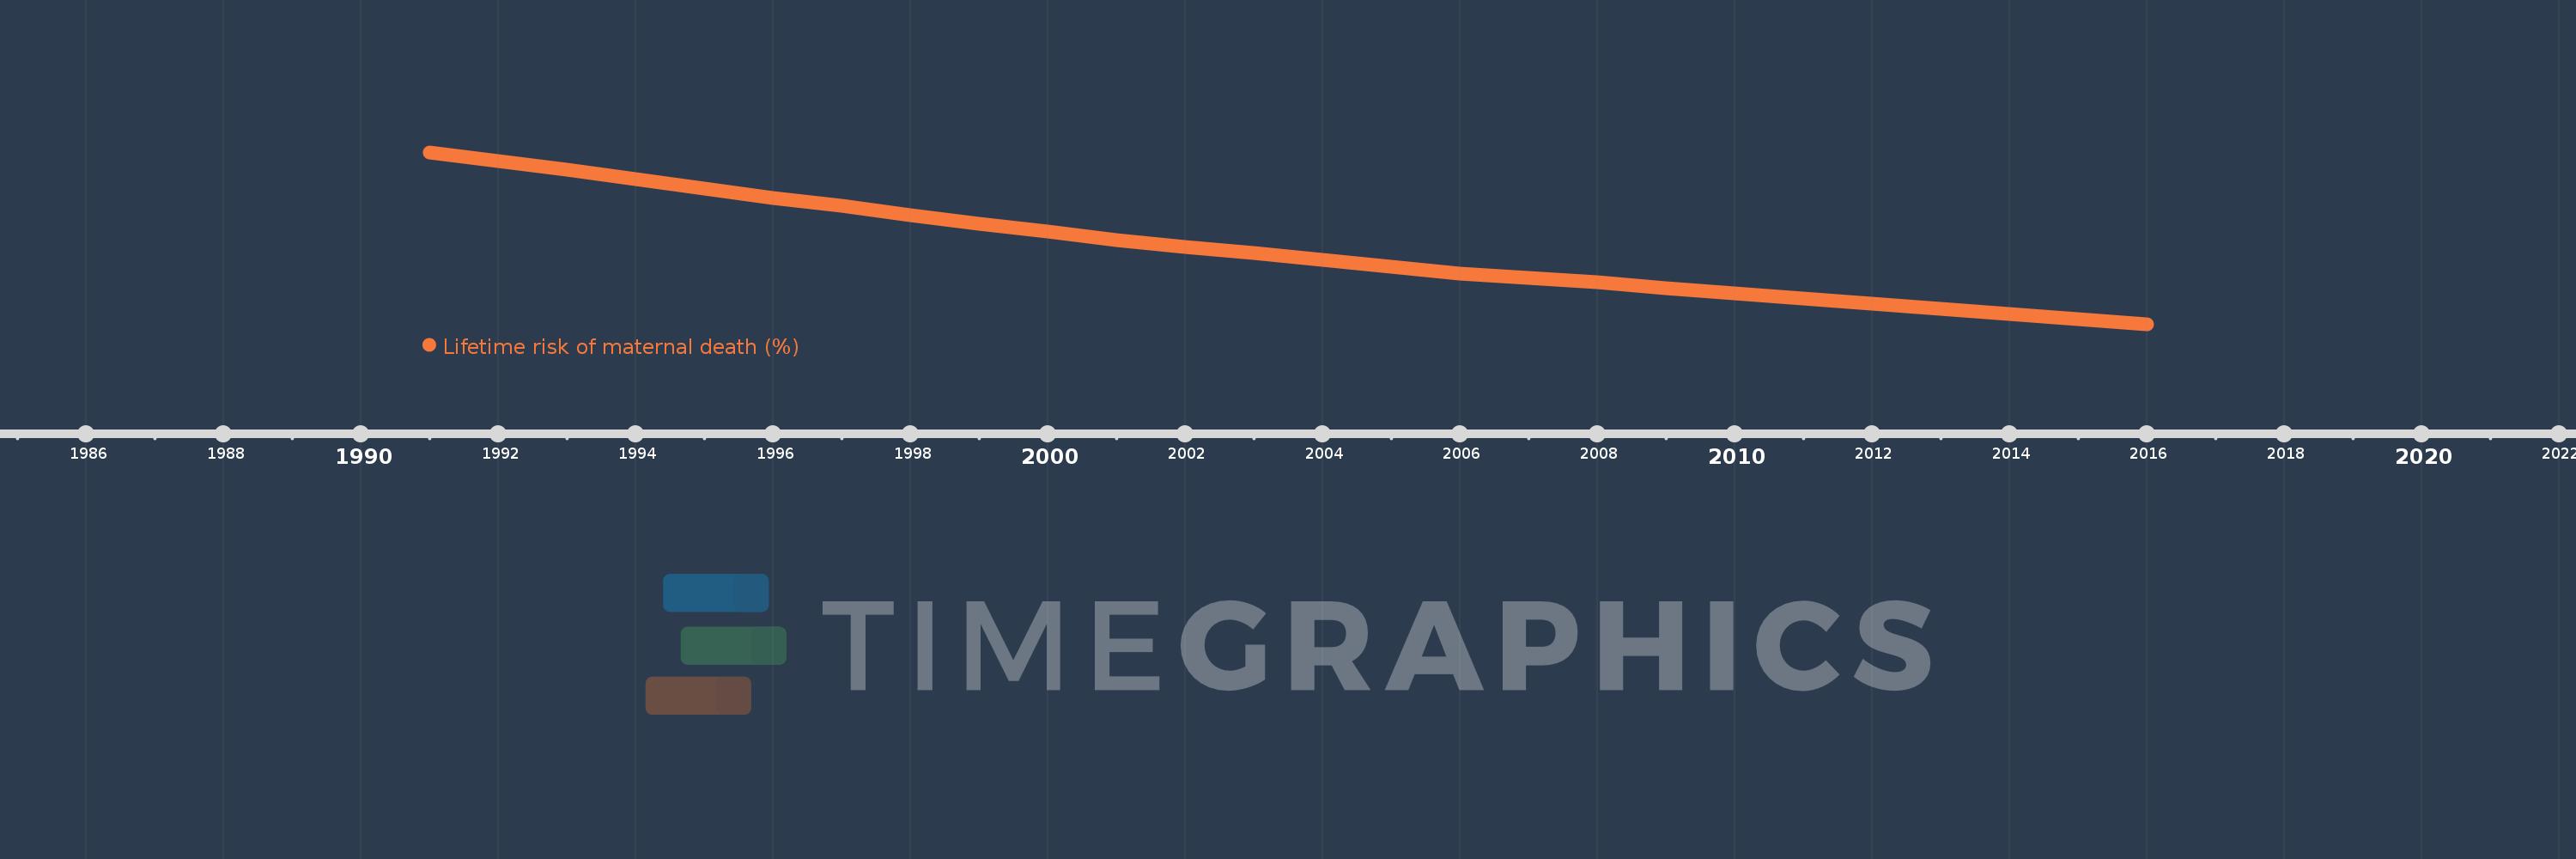
This timeline shows a graph from 1991 to 2016 of Burkina Faso. No data until 1990. Number of actual observations by date: 26.
Source name:
World Development Indicators
Source organization:
WHO, UNICEF, UNFPA, The World Bank, and the United Nations Population Division. Trends in Maternal Mortality: 1990 to 2015. Geneva, World Health Organization, 2015
Categories, topics:
Health, Gender
Last updated:
apr 23, 2017
Indicators value changes by year
Meaning:
3.319
Minimum:
2.07
jan 1, 2016
Maximum:
4.929
jan 1, 1991
At the date of observation
Value
Absolute change
Change from the previous value
jan 1, 1991
4.929
+4.929
0.0%
jan 1, 1992
4.784
-0.145
-2.95%
jan 1, 1993
4.647
-0.137
-2.87%
jan 1, 1994
4.486
-0.161
-3.47%
jan 1, 1995
4.326
-0.16
-3.56%
jan 1, 1996
4.164
-0.161
-3.73%
jan 1, 1997
4.038
-0.126
-3.03%
jan 1, 1998
3.885
-0.153
-3.79%
jan 1, 1999
3.736
-0.149
-3.85%
jan 1, 2000
3.606
-0.13
-3.48%
jan 1, 2001
3.472
-0.134
-3.72%
jan 1, 2002
3.356
-0.116
-3.34%
jan 1, 2003
3.255
-0.101
-3.01%
jan 1, 2004
3.142
-0.113
-3.47%
jan 1, 2005
3.022
-0.12
-3.83%
jan 1, 2006
2.918
-0.103
-3.42%
jan 1, 2007
2.841
-0.077
-2.64%
jan 1, 2008
2.762
-0.08
-2.8%
jan 1, 2009
2.667
-0.095
-3.42%
jan 1, 2010
2.587
-0.081
-3.02%
jan 1, 2011
2.492
-0.095
-3.65%
jan 1, 2012
2.406
-0.086
-3.46%
jan 1, 2013
2.32
-0.086
-3.59%
jan 1, 2014
2.235
-0.085
-3.65%
jan 1, 2015
2.149
-0.086
-3.85%
jan 1, 2016
2.07
-0.079
-3.67%
Ranking of countries by current statistics by years
