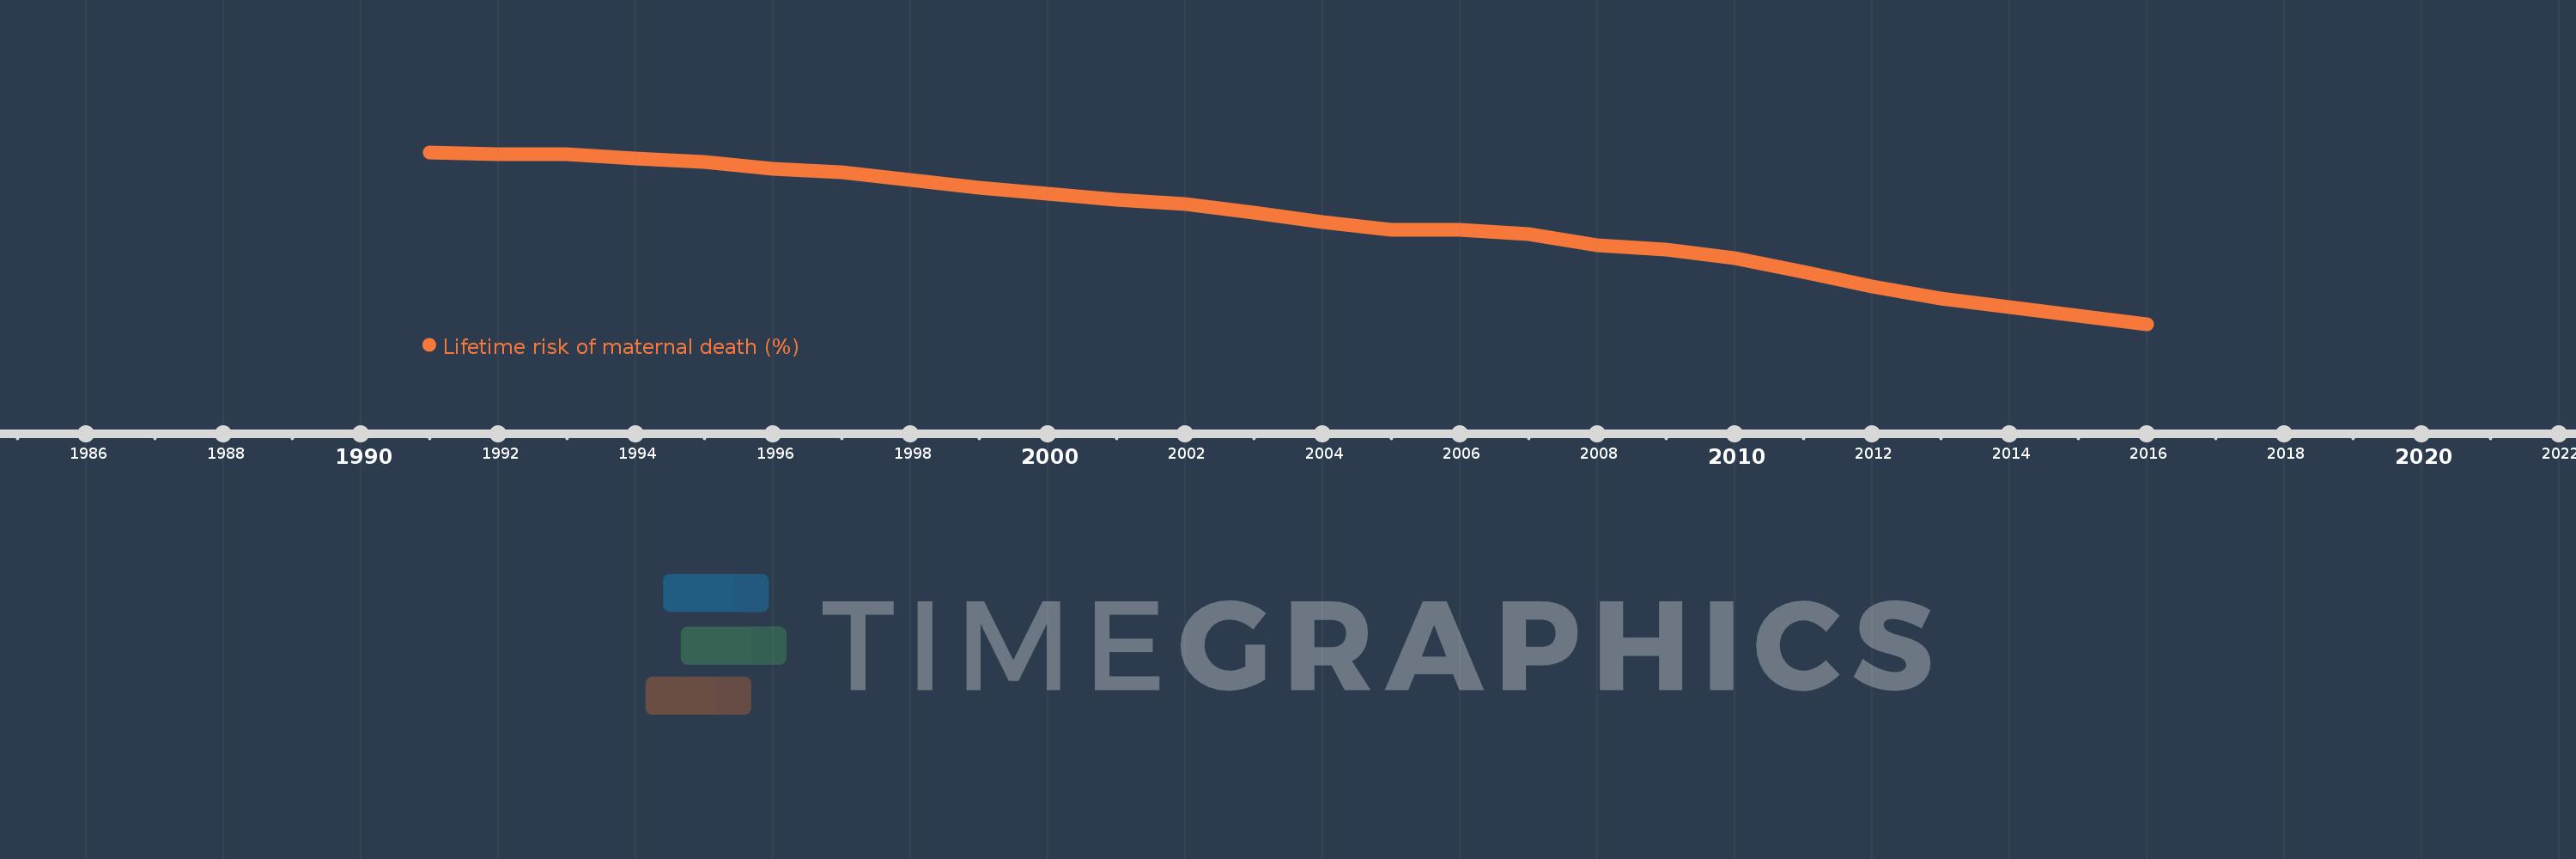
This timeline shows a graph from 1991 to 2016 of Cameroon. No data until 1990. Number of actual observations by date: 26.
Source name:
World Development Indicators
Source organization:
WHO, UNICEF, UNFPA, The World Bank, and the United Nations Population Division. Trends in Maternal Mortality: 1990 to 2015. Geneva, World Health Organization, 2015
Categories, topics:
Health, Gender
Last updated:
apr 23, 2017
Indicators value changes by year
Meaning:
4.05
Minimum:
2.888
jan 1, 2016
Maximum:
4.842
jan 1, 1991
At the date of observation
Value
Absolute change
Change from the previous value
jan 1, 1991
4.842
+4.842
0.0%
jan 1, 1992
4.826
-0.016
-0.33%
jan 1, 1993
4.821
-0.005
-0.11%
jan 1, 1994
4.774
-0.047
-0.97%
jan 1, 1995
4.736
-0.038
-0.8%
jan 1, 1996
4.658
-0.078
-1.64%
jan 1, 1997
4.612
-0.046
-0.98%
jan 1, 1998
4.524
-0.088
-1.9%
jan 1, 1999
4.442
-0.082
-1.82%
jan 1, 2000
4.374
-0.068
-1.54%
jan 1, 2001
4.304
-0.069
-1.58%
jan 1, 2002
4.256
-0.048
-1.12%
jan 1, 2003
4.155
-0.101
-2.38%
jan 1, 2004
4.054
-0.101
-2.44%
jan 1, 2005
3.96
-0.093
-2.31%
jan 1, 2006
3.963
+0.002
0.06%
jan 1, 2007
3.909
-0.053
-1.34%
jan 1, 2008
3.782
-0.128
-3.27%
jan 1, 2009
3.734
-0.047
-1.25%
jan 1, 2010
3.64
-0.095
-2.54%
jan 1, 2011
3.485
-0.154
-4.24%
jan 1, 2012
3.321
-0.165
-4.72%
jan 1, 2013
3.184
-0.136
-4.1%
jan 1, 2014
3.078
-0.106
-3.33%
jan 1, 2015
2.989
-0.089
-2.89%
jan 1, 2016
2.888
-0.101
-3.38%
Ranking of countries by current statistics by years
