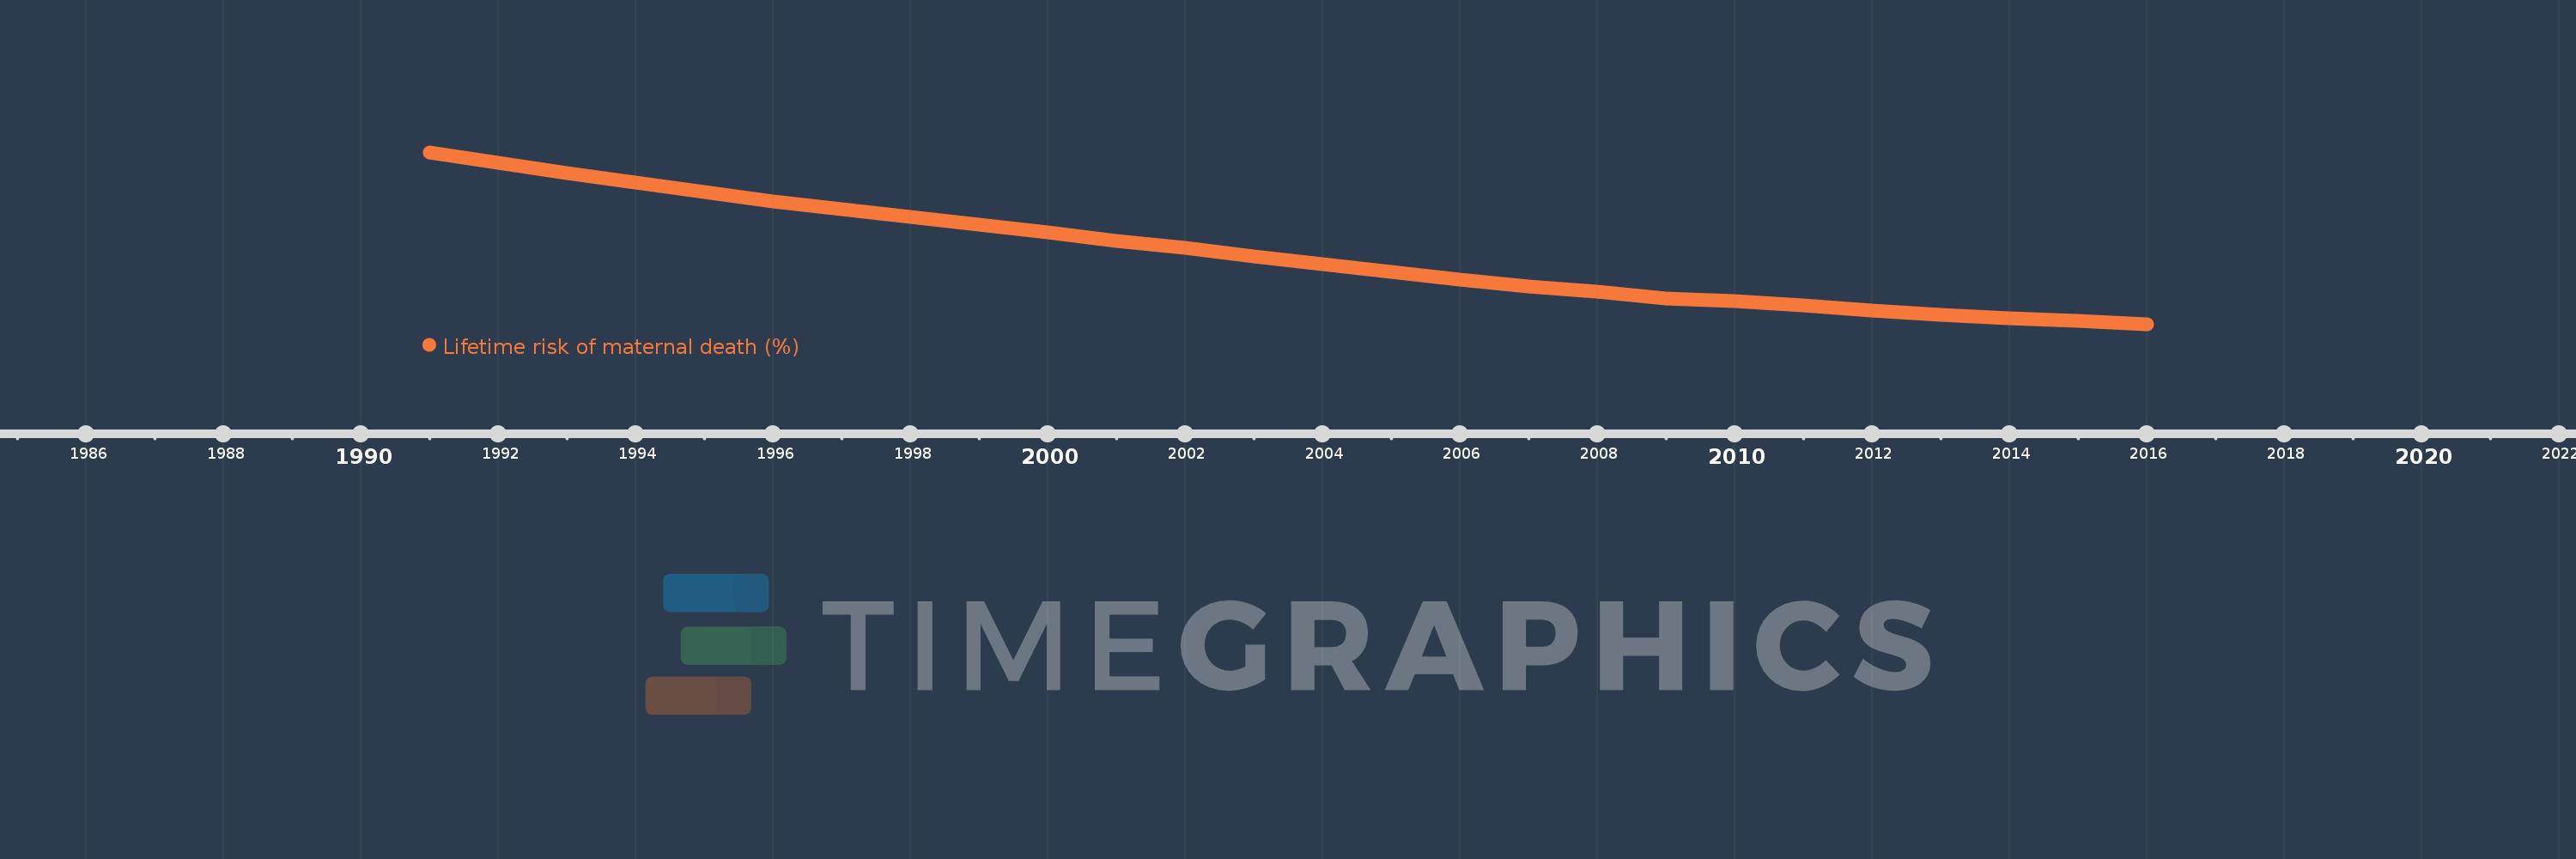
This timeline shows a graph from 1991 to 2016 of World. No data until 1990. Number of actual observations by date: 26.
Source name:
World Development Indicators
Source organization:
WHO, UNICEF, UNFPA, The World Bank, and the United Nations Population Division. Trends in Maternal Mortality: 1990 to 2015. Geneva, World Health Organization, 2015
Categories, topics:
Health, Gender
Last updated:
apr 23, 2017
Indicators value changes by year
Meaning:
0.895
Minimum:
0.56
jan 1, 2016
Maximum:
1.371
jan 1, 1991
At the date of observation
Value
Absolute change
Change from the previous value
jan 1, 1991
1.371
+1.371
0.0%
jan 1, 1992
1.32
-0.051
-3.75%
jan 1, 1993
1.273
-0.047
-3.52%
jan 1, 1994
1.228
-0.045
-3.55%
jan 1, 1995
1.183
-0.045
-3.64%
jan 1, 1996
1.141
-0.042
-3.55%
jan 1, 1997
1.103
-0.039
-3.38%
jan 1, 1998
1.065
-0.037
-3.38%
jan 1, 1999
1.029
-0.036
-3.39%
jan 1, 2000
0.992
-0.037
-3.59%
jan 1, 2001
0.954
-0.038
-3.84%
jan 1, 2002
0.919
-0.035
-3.64%
jan 1, 2003
0.881
-0.038
-4.14%
jan 1, 2004
0.843
-0.038
-4.34%
jan 1, 2005
0.806
-0.037
-4.43%
jan 1, 2006
0.771
-0.035
-4.33%
jan 1, 2007
0.738
-0.033
-4.29%
jan 1, 2008
0.712
-0.025
-3.44%
jan 1, 2009
0.682
-0.031
-4.3%
jan 1, 2010
0.669
-0.013
-1.91%
jan 1, 2011
0.647
-0.022
-3.23%
jan 1, 2012
0.623
-0.024
-3.78%
jan 1, 2013
0.606
-0.017
-2.68%
jan 1, 2014
0.589
-0.017
-2.78%
jan 1, 2015
0.574
-0.015
-2.52%
jan 1, 2016
0.56
-0.014
-2.48%
Ranking of countries by current statistics by years
