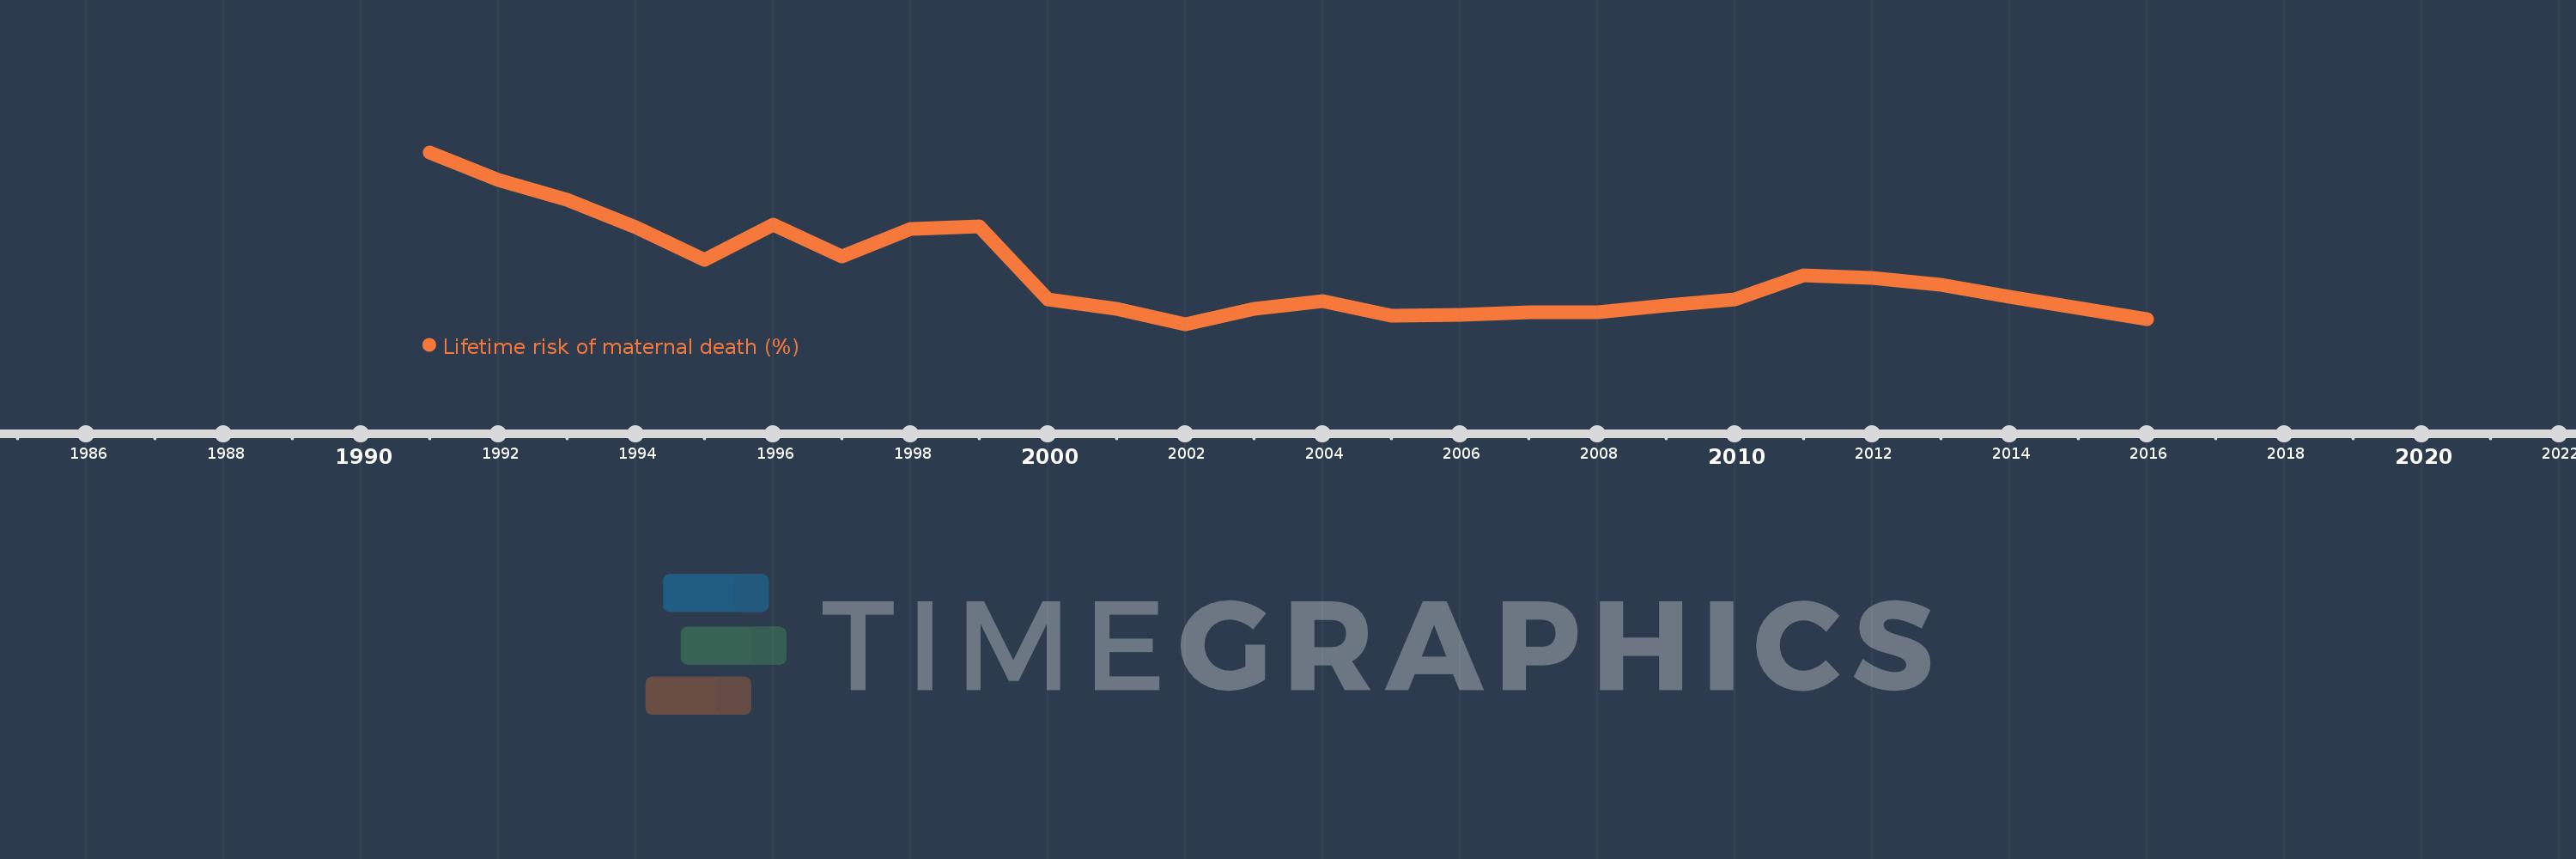
This timeline shows a graph from 1991 to 2016 of Panama. No data until 1990. Number of actual observations by date: 26.
Source name:
World Development Indicators
Source organization:
WHO, UNICEF, UNFPA, The World Bank, and the United Nations Population Division. Trends in Maternal Mortality: 1990 to 2015. Geneva, World Health Organization, 2015
Categories, topics:
Health, Gender
Last updated:
apr 23, 2017
Indicators value changes by year
Meaning:
0.273
Minimum:
0.236
jan 1, 2002
Maximum:
0.362
jan 1, 1991
At the date of observation
Value
Absolute change
Change from the previous value
jan 1, 1991
0.362
+0.362
0.0%
jan 1, 1992
0.342
-0.021
-5.71%
jan 1, 1993
0.327
-0.014
-4.22%
jan 1, 1994
0.307
-0.02
-6.18%
jan 1, 1995
0.283
-0.024
-7.74%
jan 1, 1996
0.309
+0.026
9.06%
jan 1, 1997
0.286
-0.023
-7.42%
jan 1, 1998
0.306
+0.02
7.09%
jan 1, 1999
0.308
+0.002
0.62%
jan 1, 2000
0.254
-0.055
-17.7%
jan 1, 2001
0.247
-0.006
-2.5%
jan 1, 2002
0.236
-0.012
-4.77%
jan 1, 2003
0.247
+0.011
4.84%
jan 1, 2004
0.253
+0.006
2.59%
jan 1, 2005
0.242
-0.012
-4.6%
jan 1, 2006
0.243
+0.001
0.56%
jan 1, 2007
0.245
+0.002
0.63%
jan 1, 2008
0.245
+0.001
0.34%
jan 1, 2009
0.25
+0.005
1.94%
jan 1, 2010
0.254
+0.004
1.42%
jan 1, 2011
0.272
+0.018
7.06%
jan 1, 2012
0.27
-0.002
-0.76%
jan 1, 2013
0.265
-0.005
-1.76%
jan 1, 2014
0.256
-0.008
-3.18%
jan 1, 2015
0.248
-0.009
-3.35%
jan 1, 2016
0.24
-0.008
-3.34%
Ranking of countries by current statistics by years
