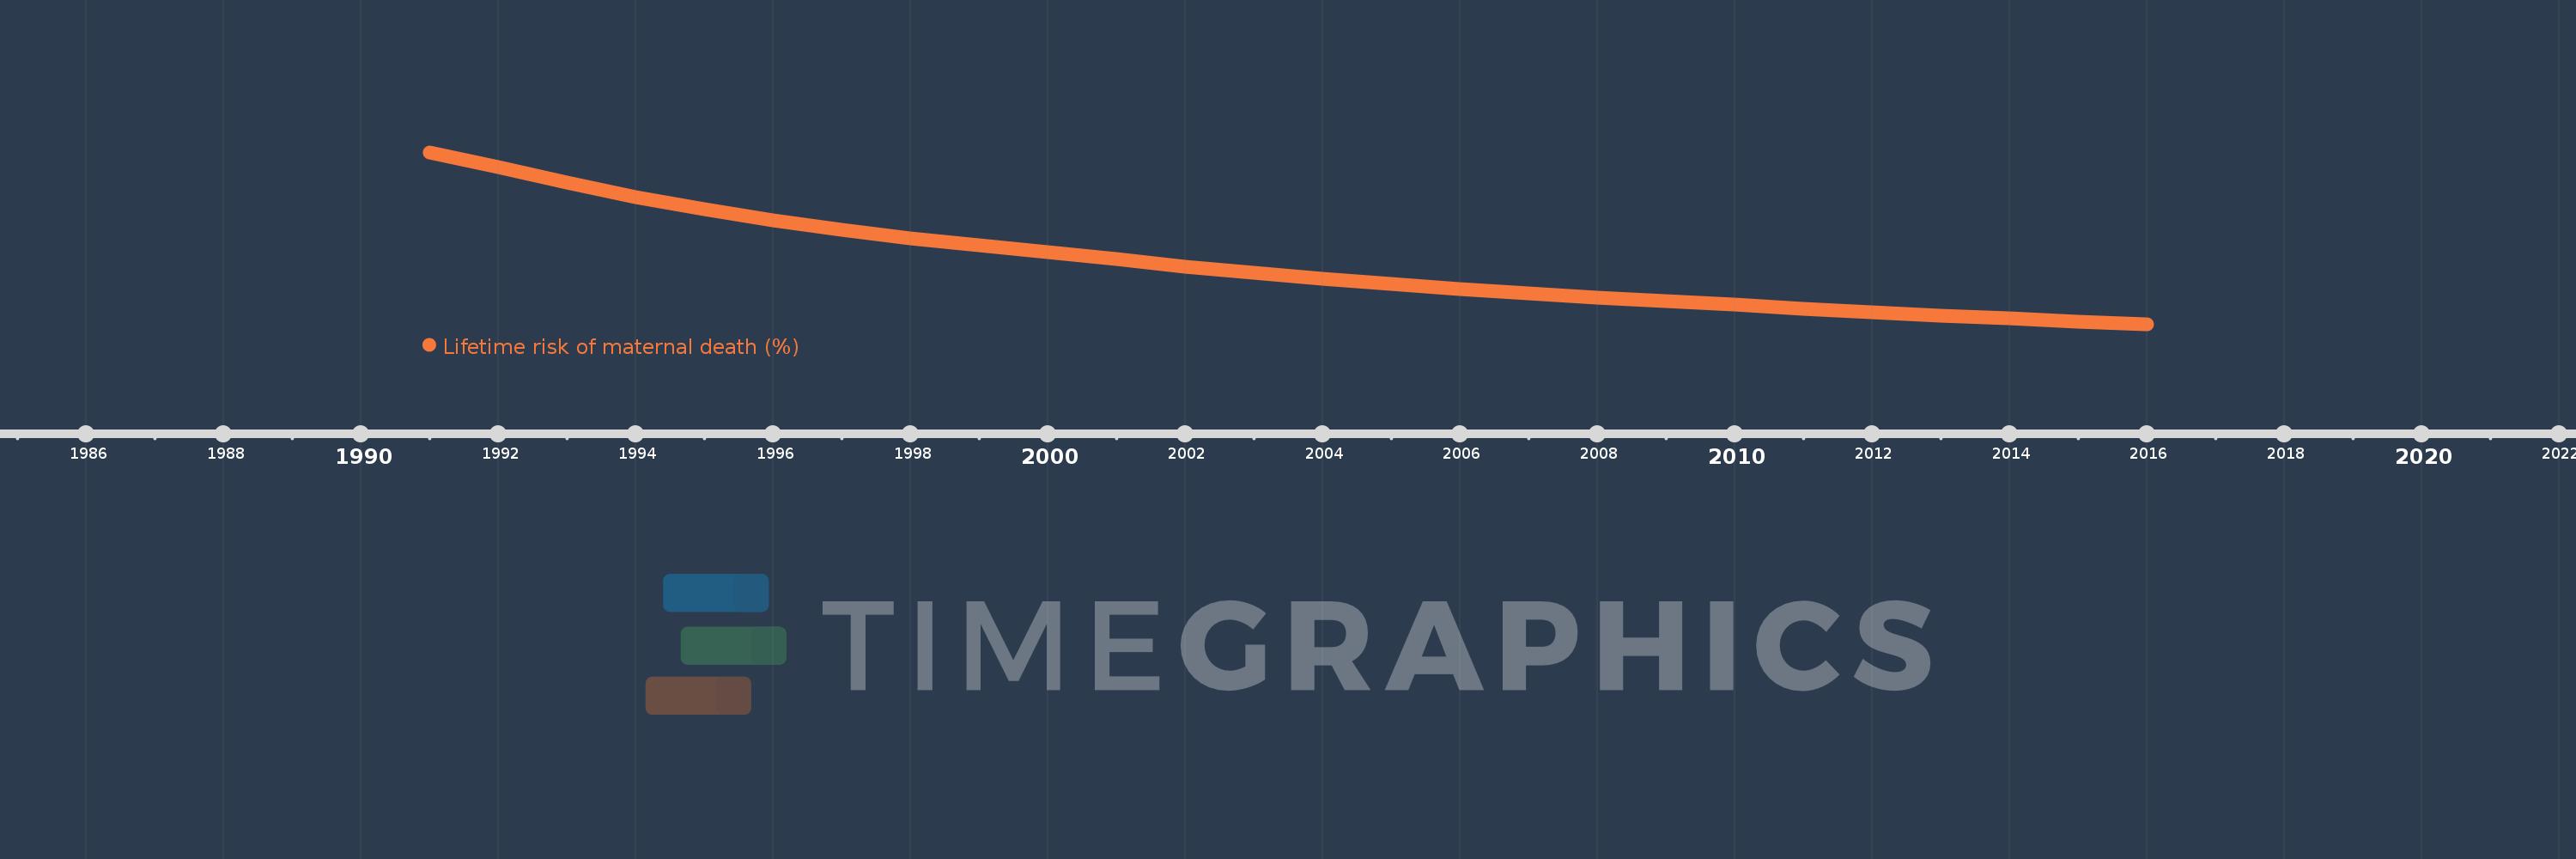
This timeline shows a graph from 1991 to 2016 of Solomon Islands. No data until 1990. Number of actual observations by date: 26.
Source name:
World Development Indicators
Source organization:
WHO, UNICEF, UNFPA, The World Bank, and the United Nations Population Division. Trends in Maternal Mortality: 1990 to 2015. Geneva, World Health Organization, 2015
Categories, topics:
Health, Gender
Last updated:
apr 23, 2017
Indicators value changes by year
Meaning:
1.044
Minimum:
0.459
jan 1, 2016
Maximum:
2.106
jan 1, 1991
At the date of observation
Value
Absolute change
Change from the previous value
jan 1, 1991
2.106
+2.106
0.0%
jan 1, 1992
1.966
-0.139
-6.62%
jan 1, 1993
1.82
-0.147
-7.45%
jan 1, 1994
1.675
-0.145
-7.96%
jan 1, 1995
1.558
-0.117
-6.97%
jan 1, 1996
1.453
-0.105
-6.77%
jan 1, 1997
1.361
-0.092
-6.33%
jan 1, 1998
1.282
-0.079
-5.8%
jan 1, 1999
1.214
-0.068
-5.3%
jan 1, 2000
1.149
-0.065
-5.36%
jan 1, 2001
1.08
-0.069
-5.97%
jan 1, 2002
1.014
-0.066
-6.15%
jan 1, 2003
0.955
-0.059
-5.82%
jan 1, 2004
0.895
-0.06
-6.24%
jan 1, 2005
0.843
-0.052
-5.84%
jan 1, 2006
0.795
-0.048
-5.71%
jan 1, 2007
0.756
-0.039
-4.92%
jan 1, 2008
0.716
-0.04
-5.29%
jan 1, 2009
0.683
-0.032
-4.52%
jan 1, 2010
0.647
-0.037
-5.37%
jan 1, 2011
0.61
-0.036
-5.61%
jan 1, 2012
0.576
-0.034
-5.64%
jan 1, 2013
0.542
-0.034
-5.82%
jan 1, 2014
0.514
-0.028
-5.25%
jan 1, 2015
0.485
-0.029
-5.56%
jan 1, 2016
0.459
-0.027
-5.53%
Ranking of countries by current statistics by years
