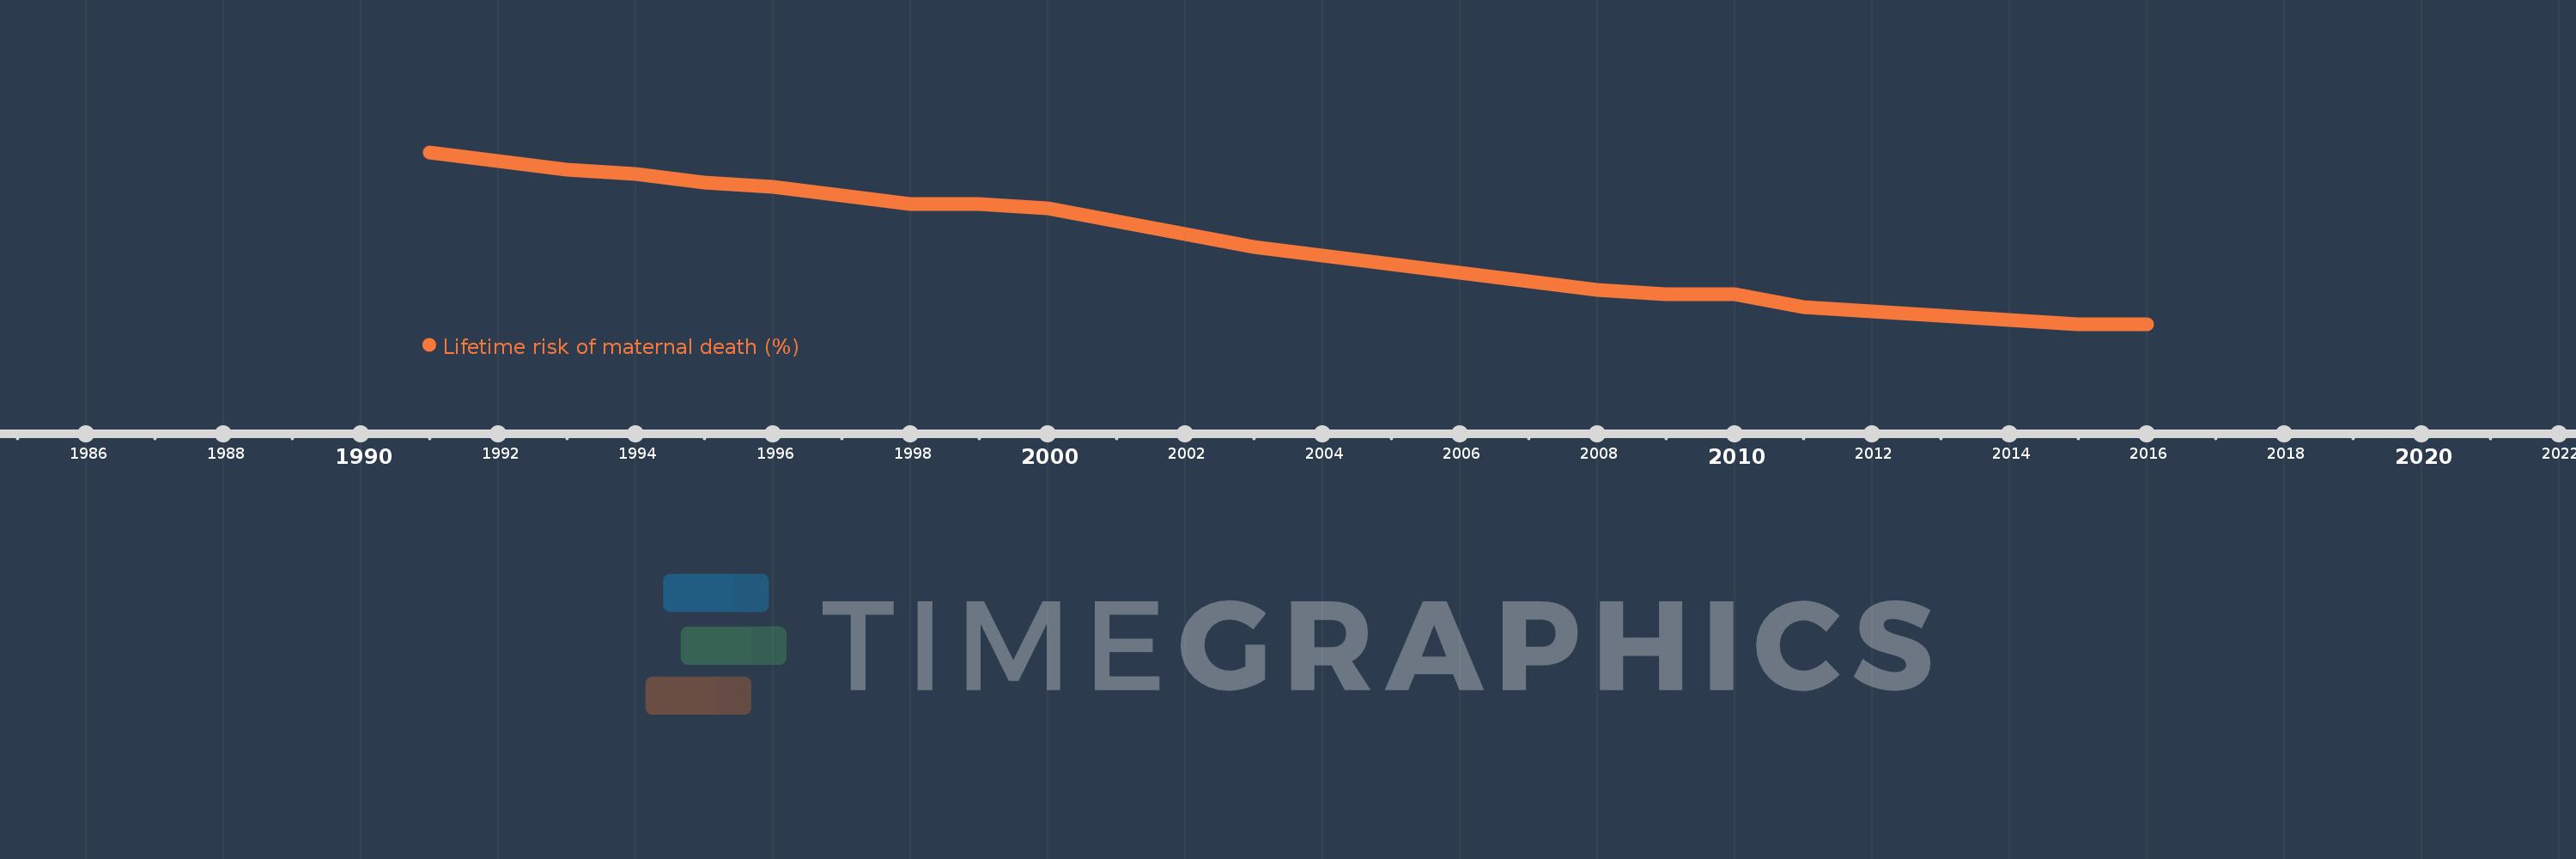
This timeline shows a graph from 1991 to 2016 of OECD members. No data until 1990. Number of actual observations by date: 26.
Source name:
World Development Indicators
Source organization:
WHO, UNICEF, UNFPA, The World Bank, and the United Nations Population Division. Trends in Maternal Mortality: 1990 to 2015. Geneva, World Health Organization, 2015
Categories, topics:
Health, Gender
Last updated:
apr 23, 2017
Indicators value changes by year
Meaning:
0.044
Minimum:
0.026
jan 1, 2016
Maximum:
0.066
jan 1, 1991
At the date of observation
Value
Absolute change
Change from the previous value
jan 1, 1991
0.066
+0.066
0.0%
jan 1, 1992
0.064
-0.002
-3.74%
jan 1, 1993
0.062
-0.002
-2.87%
jan 1, 1994
0.061
-0.001
-1.76%
jan 1, 1995
0.059
-0.002
-2.65%
jan 1, 1996
0.058
-0.001
-2.01%
jan 1, 1997
0.056
-0.002
-3.7%
jan 1, 1998
0.054
-0.001
-2.54%
jan 1, 1999
0.054
0.0
-0.86%
jan 1, 2000
0.053
-0.001
-2.16%
jan 1, 2001
0.05
-0.002
-4.26%
jan 1, 2002
0.047
-0.003
-6.09%
jan 1, 2003
0.044
-0.003
-6.6%
jan 1, 2004
0.042
-0.002
-4.78%
jan 1, 2005
0.04
-0.002
-5.21%
jan 1, 2006
0.038
-0.002
-3.84%
jan 1, 2007
0.036
-0.003
-6.75%
jan 1, 2008
0.034
-0.002
-4.65%
jan 1, 2009
0.033
-0.001
-3.44%
jan 1, 2010
0.033
+0.0
0.56%
jan 1, 2011
0.03
-0.003
-9.89%
jan 1, 2012
0.029
-0.001
-4.63%
jan 1, 2013
0.028
-0.001
-2.53%
jan 1, 2014
0.027
-0.001
-2.08%
jan 1, 2015
0.026
-0.001
-3.47%
jan 1, 2016
0.026
-0.001
-2.61%
Ranking of countries by current statistics by years
