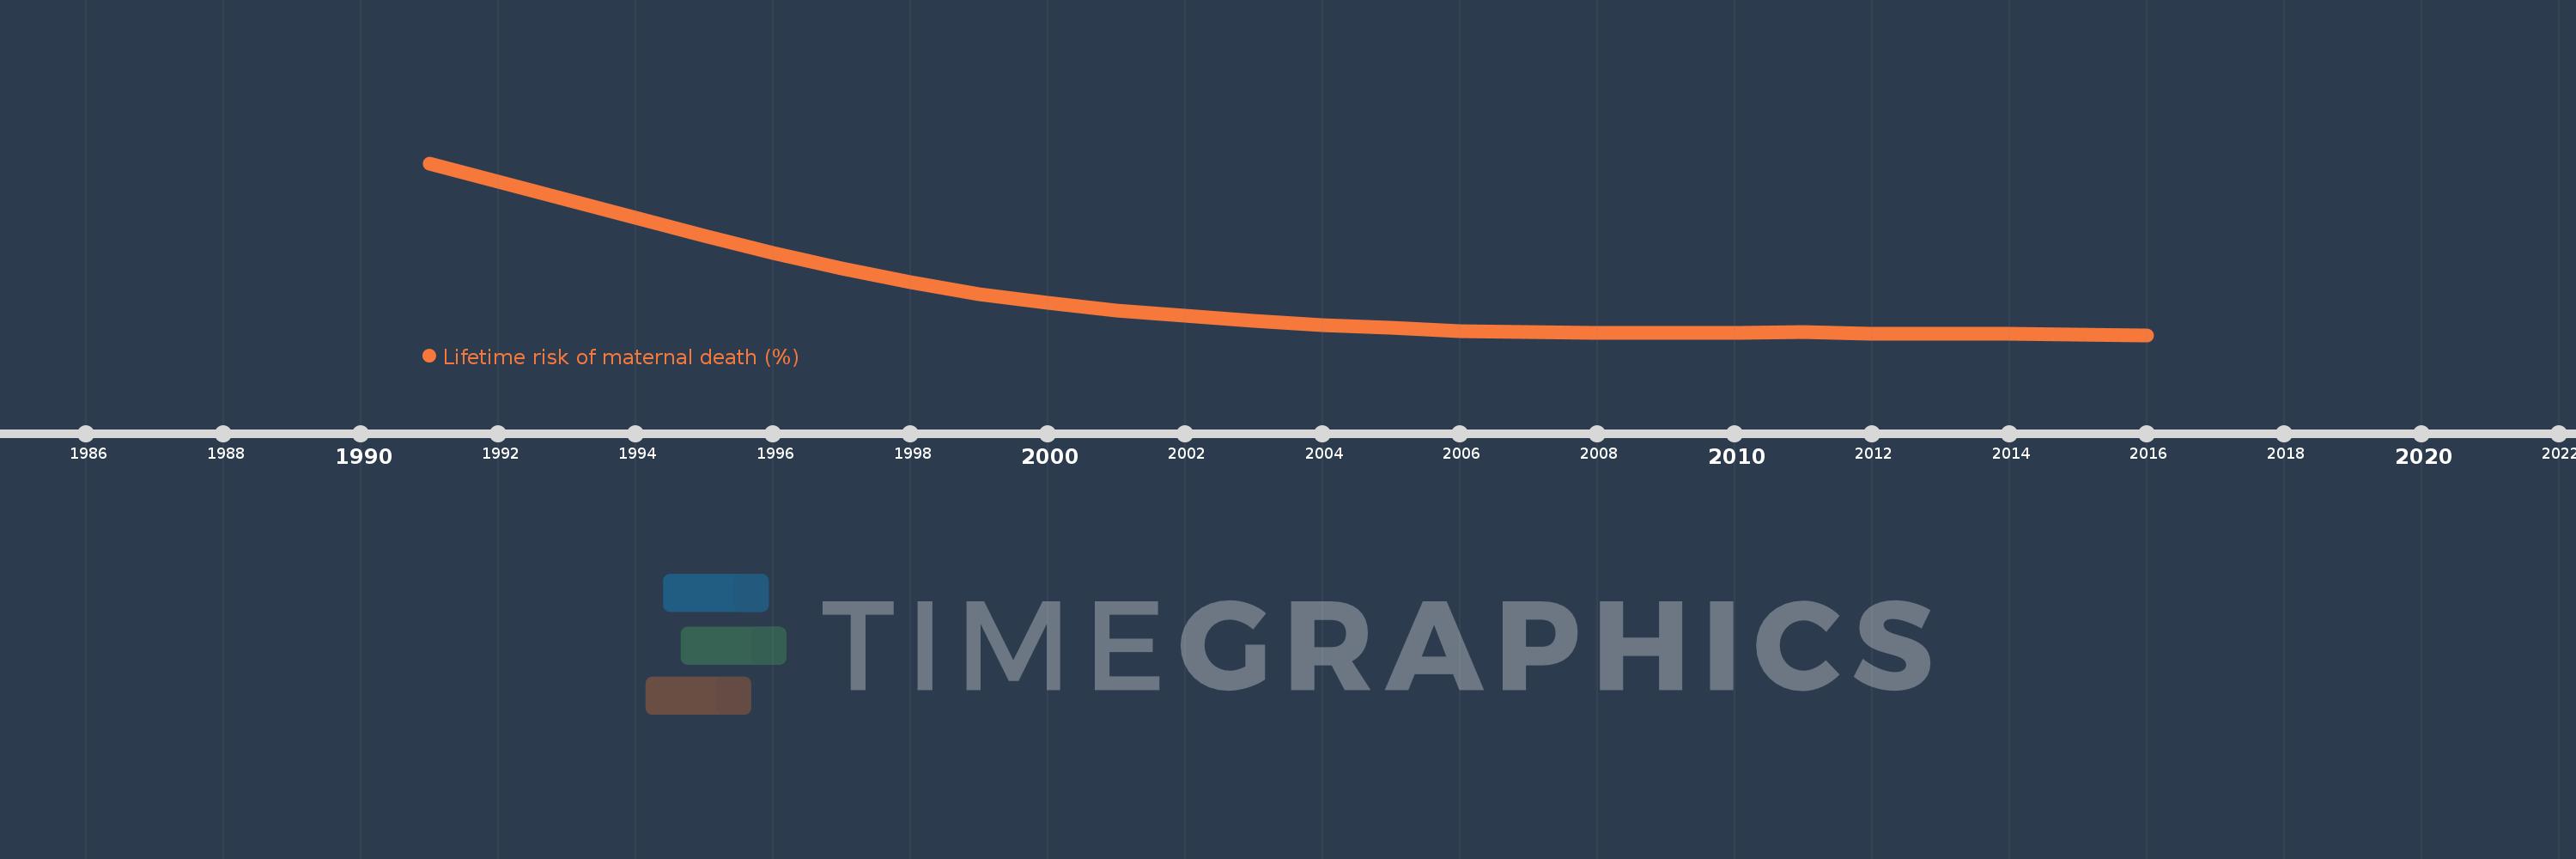
This timeline shows a graph from 1991 to 2016 of Vietnam. No data until 1990. Number of actual observations by date: 26.
Source name:
World Development Indicators
Source organization:
WHO, UNICEF, UNFPA, The World Bank, and the United Nations Population Division. Trends in Maternal Mortality: 1990 to 2015. Geneva, World Health Organization, 2015
Categories, topics:
Health, Gender
Last updated:
apr 23, 2017
Indicators value changes by year
Meaning:
0.22
Minimum:
0.114
jan 1, 2016
Maximum:
0.564
jan 1, 1991
At the date of observation
Value
Absolute change
Change from the previous value
jan 1, 1991
0.564
+0.564
0.0%
jan 1, 1992
0.515
-0.049
-8.64%
jan 1, 1993
0.468
-0.047
-9.12%
jan 1, 1994
0.421
-0.047
-10.04%
jan 1, 1995
0.373
-0.048
-11.34%
jan 1, 1996
0.329
-0.045
-11.94%
jan 1, 1997
0.288
-0.041
-12.45%
jan 1, 1998
0.252
-0.036
-12.47%
jan 1, 1999
0.222
-0.03
-11.8%
jan 1, 2000
0.198
-0.024
-11.0%
jan 1, 2001
0.179
-0.019
-9.5%
jan 1, 2002
0.164
-0.015
-8.63%
jan 1, 2003
0.151
-0.013
-7.7%
jan 1, 2004
0.141
-0.01
-6.51%
jan 1, 2005
0.133
-0.009
-6.12%
jan 1, 2006
0.125
-0.007
-5.54%
jan 1, 2007
0.121
-0.004
-3.5%
jan 1, 2008
0.12
-0.001
-0.51%
jan 1, 2009
0.12
-0.001
-0.47%
jan 1, 2010
0.12
+0.0
0.39%
jan 1, 2011
0.123
+0.003
2.31%
jan 1, 2012
0.118
-0.005
-4.13%
jan 1, 2013
0.118
+0.001
0.47%
jan 1, 2014
0.117
-0.001
-1.09%
jan 1, 2015
0.115
-0.002
-1.58%
jan 1, 2016
0.114
-0.001
-0.62%
Ranking of countries by current statistics by years
