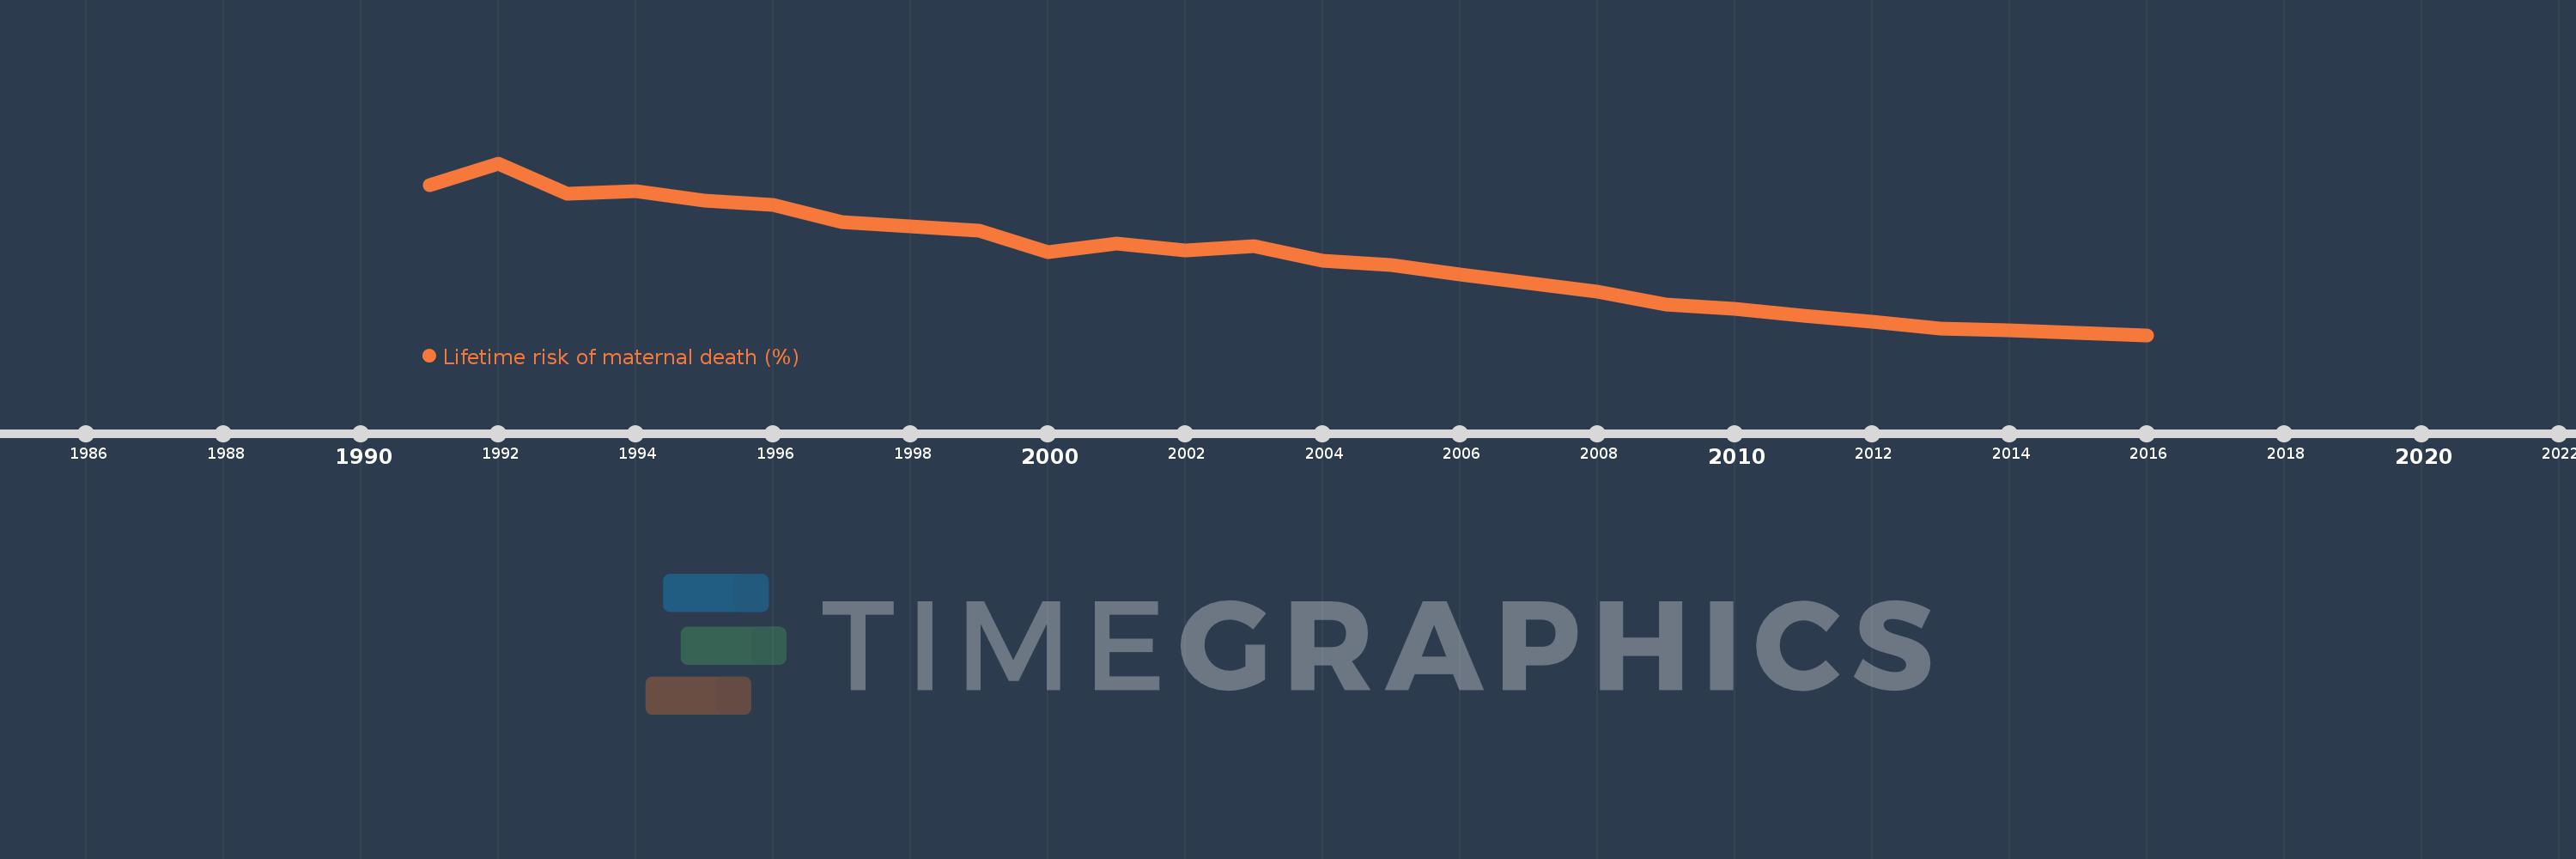
This timeline shows a graph from 1991 to 2016 of Uruguay. No data until 1990. Number of actual observations by date: 26.
Source name:
World Development Indicators
Source organization:
WHO, UNICEF, UNFPA, The World Bank, and the United Nations Population Division. Trends in Maternal Mortality: 1990 to 2015. Geneva, World Health Organization, 2015
Categories, topics:
Health, Gender
Last updated:
apr 23, 2017
Indicators value changes by year
Meaning:
0.064
Minimum:
0.03
jan 1, 2016
Maximum:
0.109
jan 1, 1992
At the date of observation
Value
Absolute change
Change from the previous value
jan 1, 1991
0.099
+0.099
0.0%
jan 1, 1992
0.109
+0.01
10.13%
jan 1, 1993
0.095
-0.014
-13.19%
jan 1, 1994
0.096
+0.001
1.33%
jan 1, 1995
0.092
-0.004
-3.84%
jan 1, 1996
0.09
-0.003
-2.89%
jan 1, 1997
0.082
-0.008
-8.46%
jan 1, 1998
0.08
-0.003
-3.06%
jan 1, 1999
0.078
-0.002
-2.28%
jan 1, 2000
0.068
-0.01
-12.62%
jan 1, 2001
0.072
+0.004
5.97%
jan 1, 2002
0.069
-0.003
-4.23%
jan 1, 2003
0.071
+0.002
2.41%
jan 1, 2004
0.064
-0.007
-9.84%
jan 1, 2005
0.062
-0.002
-2.93%
jan 1, 2006
0.058
-0.004
-6.25%
jan 1, 2007
0.054
-0.004
-7.03%
jan 1, 2008
0.05
-0.004
-7.46%
jan 1, 2009
0.044
-0.006
-11.94%
jan 1, 2010
0.042
-0.002
-4.86%
jan 1, 2011
0.039
-0.003
-6.24%
jan 1, 2012
0.036
-0.003
-7.97%
jan 1, 2013
0.033
-0.003
-7.17%
jan 1, 2014
0.032
-0.001
-3.69%
jan 1, 2015
0.031
-0.001
-3.22%
jan 1, 2016
0.03
-0.001
-3.04%
Ranking of countries by current statistics by years
