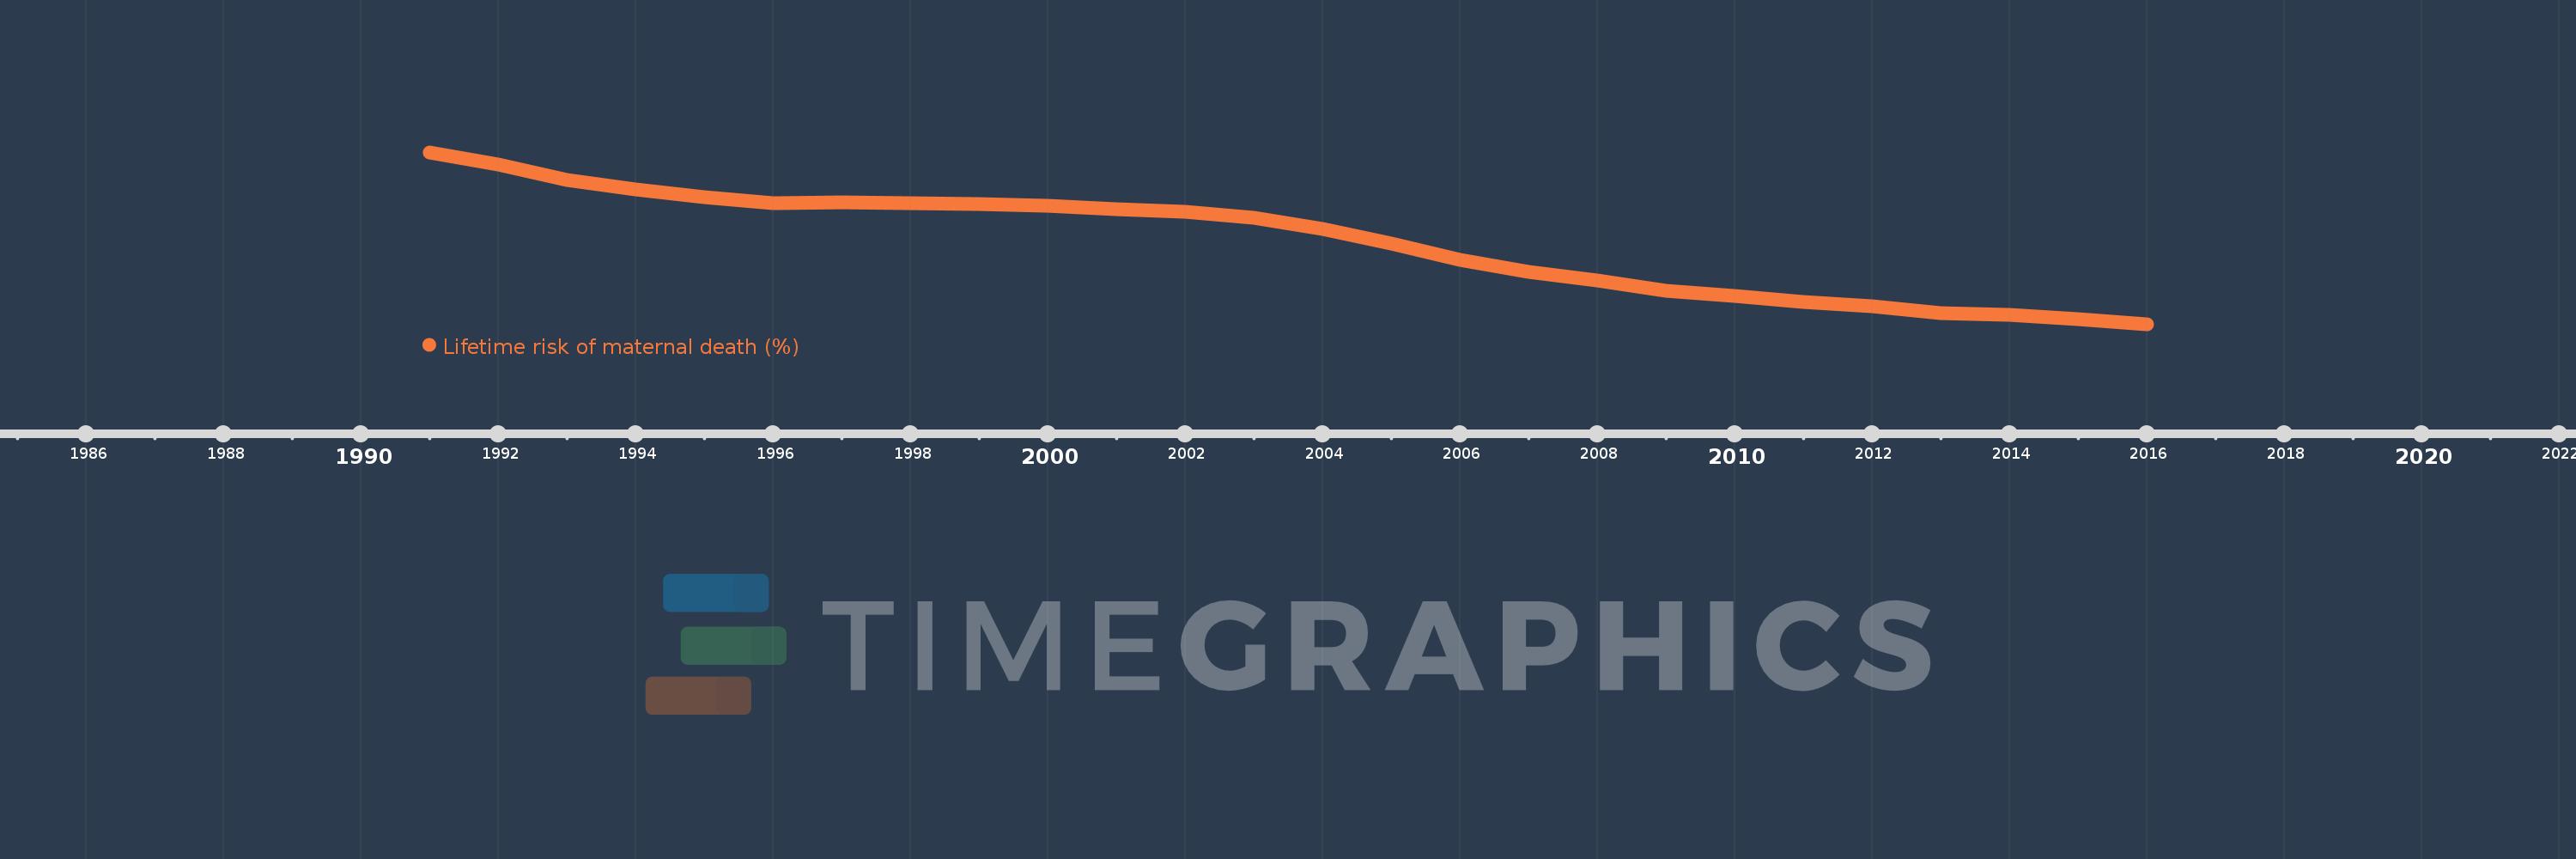
This timeline shows a graph from 1991 to 2016 of Guinea. No data until 1990. Number of actual observations by date: 26.
Source name:
World Development Indicators
Source organization:
WHO, UNICEF, UNFPA, The World Bank, and the United Nations Population Division. Trends in Maternal Mortality: 1990 to 2015. Geneva, World Health Organization, 2015
Categories, topics:
Health, Gender
Last updated:
apr 23, 2017
Indicators value changes by year
Meaning:
5.172
Minimum:
3.462
jan 1, 2016
Maximum:
7.033
jan 1, 1991
At the date of observation
Value
Absolute change
Change from the previous value
jan 1, 1991
7.033
+7.033
0.0%
jan 1, 1992
6.779
-0.254
-3.62%
jan 1, 1993
6.457
-0.322
-4.75%
jan 1, 1994
6.265
-0.192
-2.97%
jan 1, 1995
6.105
-0.161
-2.56%
jan 1, 1996
5.983
-0.122
-2.0%
jan 1, 1997
5.987
+0.004
0.07%
jan 1, 1998
5.974
-0.013
-0.21%
jan 1, 1999
5.955
-0.019
-0.32%
jan 1, 2000
5.927
-0.028
-0.47%
jan 1, 2001
5.853
-0.075
-1.26%
jan 1, 2002
5.796
-0.057
-0.97%
jan 1, 2003
5.683
-0.113
-1.95%
jan 1, 2004
5.451
-0.233
-4.09%
jan 1, 2005
5.144
-0.307
-5.63%
jan 1, 2006
4.807
-0.336
-6.54%
jan 1, 2007
4.546
-0.262
-5.44%
jan 1, 2008
4.376
-0.17
-3.74%
jan 1, 2009
4.165
-0.211
-4.82%
jan 1, 2010
4.047
-0.118
-2.83%
jan 1, 2011
3.933
-0.114
-2.81%
jan 1, 2012
3.83
-0.103
-2.62%
jan 1, 2013
3.693
-0.137
-3.57%
jan 1, 2014
3.65
-0.044
-1.18%
jan 1, 2015
3.56
-0.09
-2.45%
jan 1, 2016
3.462
-0.098
-2.75%
Ranking of countries by current statistics by years
