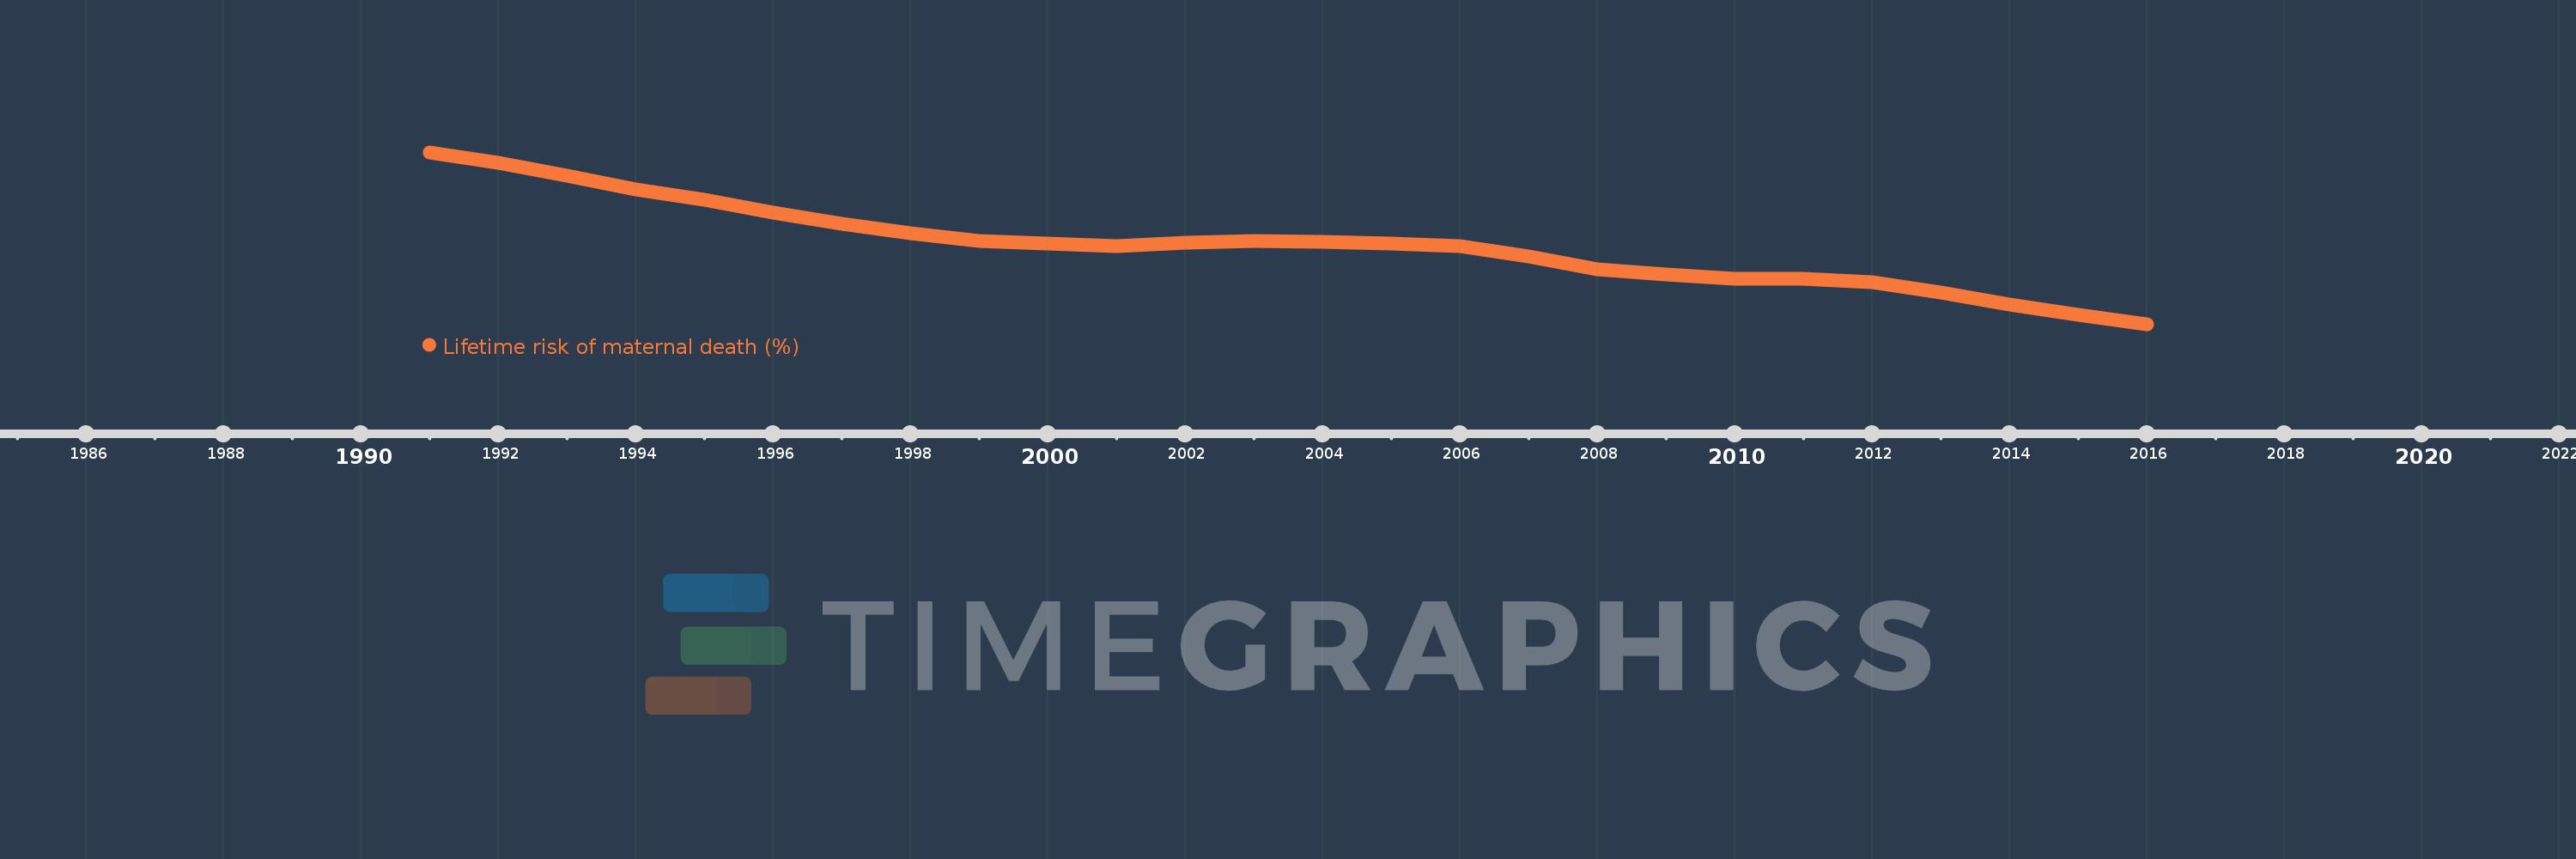
This timeline shows a graph from 1991 to 2016 of Namibia. No data until 1990. Number of actual observations by date: 26.
Source name:
World Development Indicators
Source organization:
WHO, UNICEF, UNFPA, The World Bank, and the United Nations Population Division. Trends in Maternal Mortality: 1990 to 2015. Geneva, World Health Organization, 2015
Categories, topics:
Health, Gender
Last updated:
apr 23, 2017
Indicators value changes by year
Meaning:
1.347
Minimum:
0.984
jan 1, 2016
Maximum:
1.773
jan 1, 1991
At the date of observation
Value
Absolute change
Change from the previous value
jan 1, 1991
1.773
+1.773
0.0%
jan 1, 1992
1.724
-0.049
-2.77%
jan 1, 1993
1.665
-0.059
-3.43%
jan 1, 1994
1.602
-0.063
-3.76%
jan 1, 1995
1.554
-0.048
-3.02%
jan 1, 1996
1.496
-0.058
-3.74%
jan 1, 1997
1.444
-0.052
-3.48%
jan 1, 1998
1.402
-0.042
-2.9%
jan 1, 1999
1.365
-0.037
-2.63%
jan 1, 2000
1.355
-0.01
-0.7%
jan 1, 2001
1.343
-0.013
-0.92%
jan 1, 2002
1.357
+0.014
1.06%
jan 1, 2003
1.366
+0.009
0.67%
jan 1, 2004
1.364
-0.002
-0.18%
jan 1, 2005
1.355
-0.009
-0.65%
jan 1, 2006
1.342
-0.013
-0.93%
jan 1, 2007
1.295
-0.047
-3.51%
jan 1, 2008
1.238
-0.058
-4.46%
jan 1, 2009
1.212
-0.025
-2.04%
jan 1, 2010
1.192
-0.02
-1.66%
jan 1, 2011
1.192
0.0
-0.01%
jan 1, 2012
1.176
-0.016
-1.36%
jan 1, 2013
1.129
-0.047
-4.01%
jan 1, 2014
1.074
-0.055
-4.89%
jan 1, 2015
1.028
-0.046
-4.27%
jan 1, 2016
0.984
-0.043
-4.2%
Ranking of countries by current statistics by years
