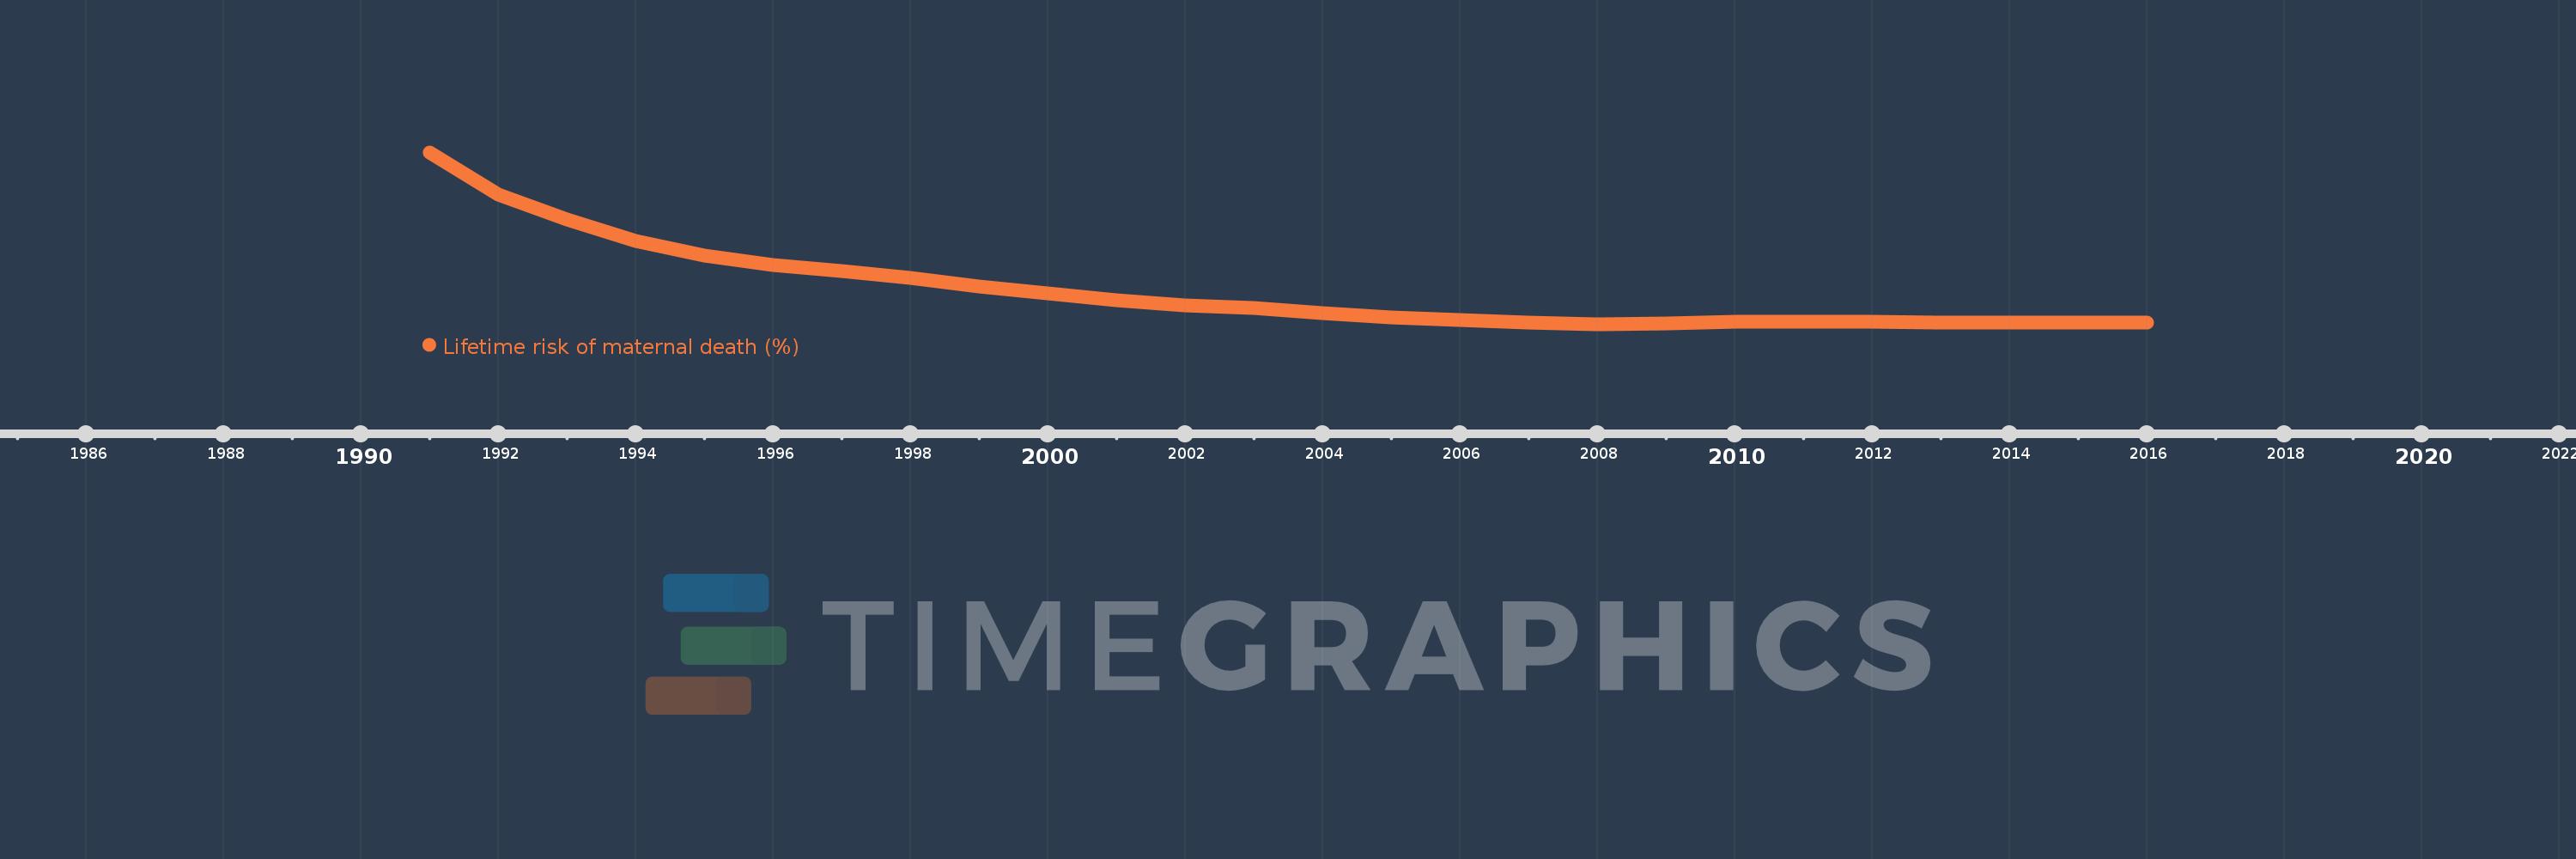
This timeline shows a graph from 1991 to 2016 of Romania. No data until 1990. Number of actual observations by date: 26.
Source name:
World Development Indicators
Source organization:
WHO, UNICEF, UNFPA, The World Bank, and the United Nations Population Division. Trends in Maternal Mortality: 1990 to 2015. Geneva, World Health Organization, 2015
Categories, topics:
Health, Gender
Last updated:
apr 23, 2017
Indicators value changes by year
Meaning:
0.08
Minimum:
0.041
jan 1, 2008
Maximum:
0.241
jan 1, 1991
At the date of observation
Value
Absolute change
Change from the previous value
jan 1, 1991
0.241
+0.241
0.0%
jan 1, 1992
0.192
-0.048
-20.07%
jan 1, 1993
0.163
-0.029
-15.28%
jan 1, 1994
0.138
-0.025
-15.16%
jan 1, 1995
0.121
-0.018
-12.86%
jan 1, 1996
0.11
-0.011
-8.85%
jan 1, 1997
0.103
-0.007
-6.72%
jan 1, 1998
0.095
-0.008
-7.5%
jan 1, 1999
0.085
-0.01
-10.55%
jan 1, 2000
0.077
-0.008
-9.17%
jan 1, 2001
0.069
-0.008
-10.37%
jan 1, 2002
0.063
-0.006
-9.13%
jan 1, 2003
0.06
-0.003
-5.17%
jan 1, 2004
0.054
-0.005
-9.13%
jan 1, 2005
0.049
-0.006
-10.29%
jan 1, 2006
0.046
-0.003
-6.11%
jan 1, 2007
0.043
-0.003
-6.65%
jan 1, 2008
0.041
-0.001
-2.86%
jan 1, 2009
0.042
+0.0
0.88%
jan 1, 2010
0.044
+0.002
4.64%
jan 1, 2011
0.044
+0.0
0.69%
jan 1, 2012
0.044
0.0
-0.07%
jan 1, 2013
0.043
-0.001
-2.01%
jan 1, 2014
0.043
0.0
-0.95%
jan 1, 2015
0.043
+0.0
0.33%
jan 1, 2016
0.043
+0.0
0.43%
Ranking of countries by current statistics by years
