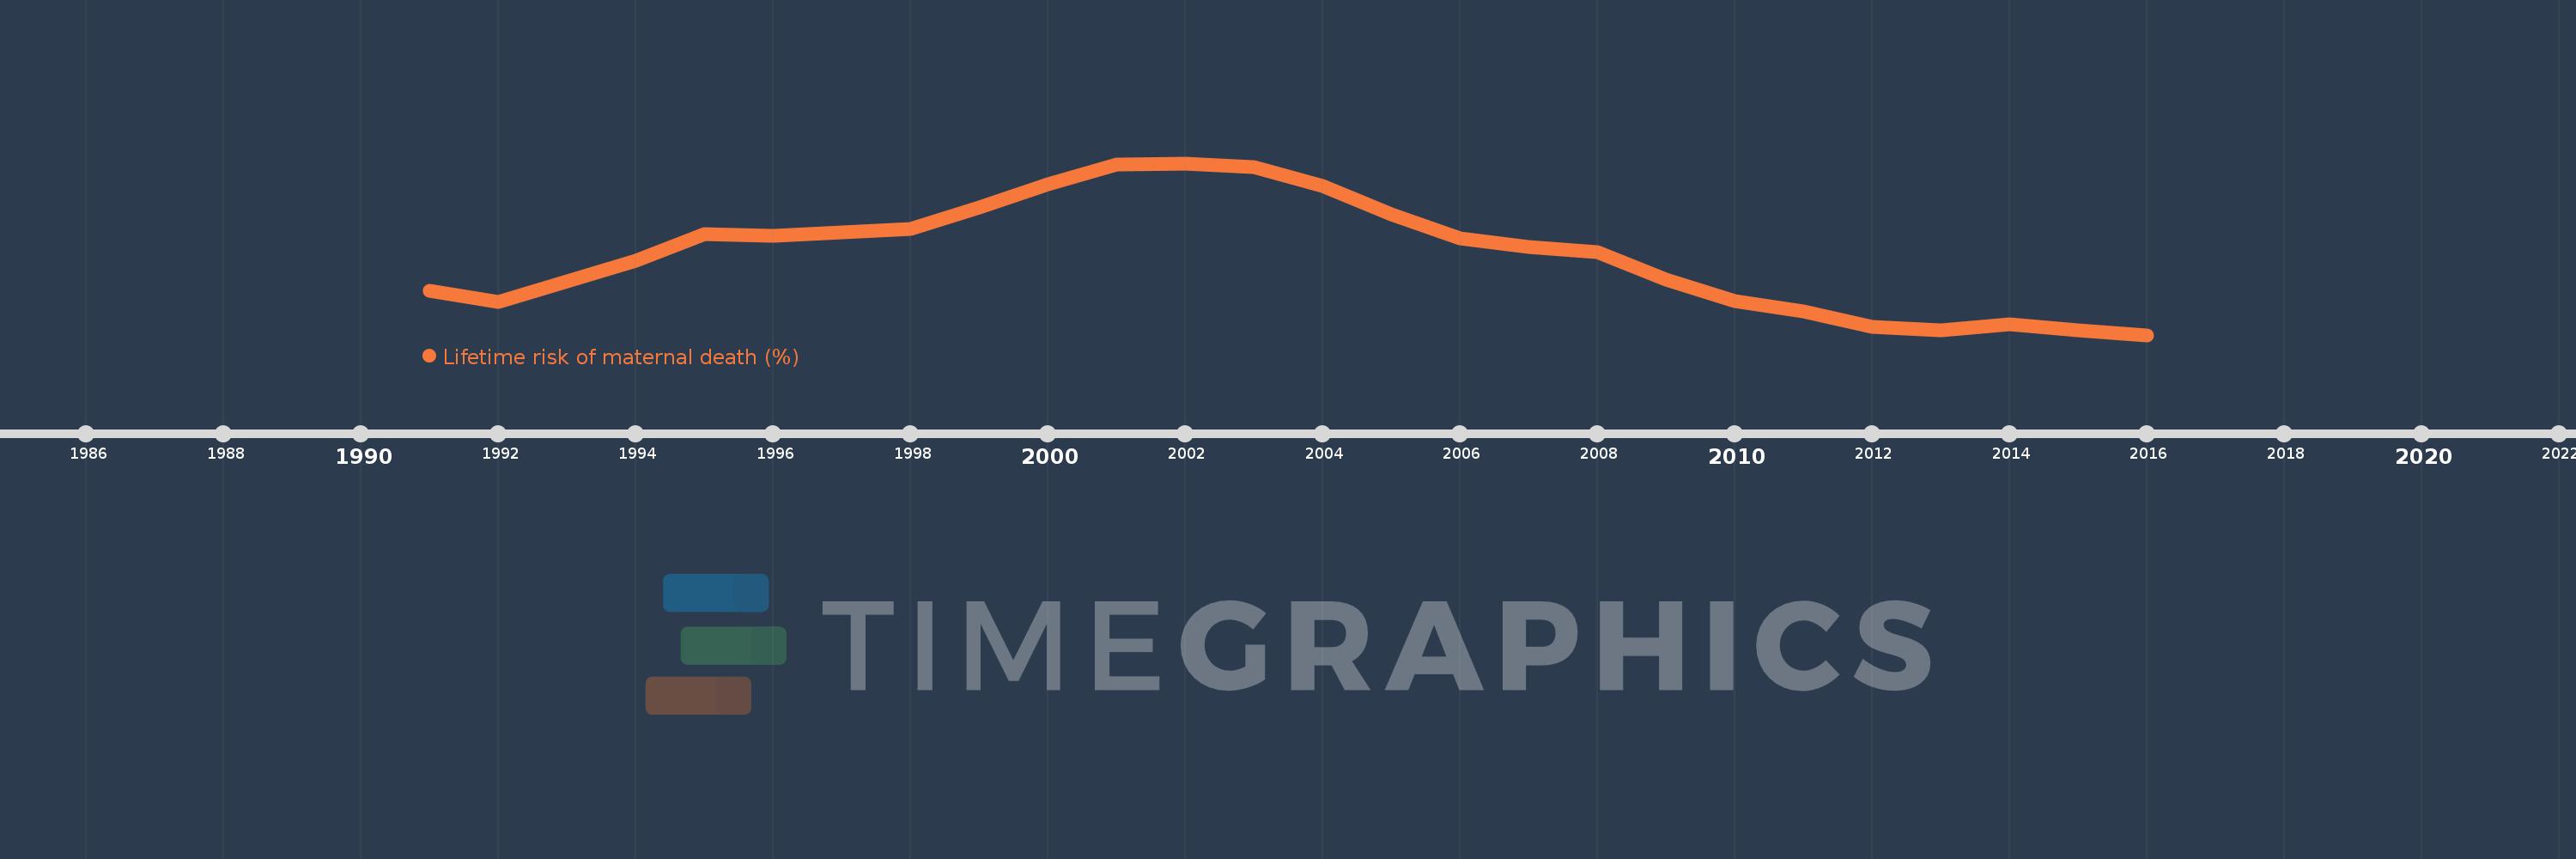
This timeline shows a graph from 1991 to 2016 of Suriname. No data until 1990. Number of actual observations by date: 26.
Source name:
World Development Indicators
Source organization:
WHO, UNICEF, UNFPA, The World Bank, and the United Nations Population Division. Trends in Maternal Mortality: 1990 to 2015. Geneva, World Health Organization, 2015
Categories, topics:
Health, Gender
Last updated:
apr 23, 2017
Indicators value changes by year
Meaning:
0.558
Minimum:
0.372
jan 1, 2016
Maximum:
0.771
jan 1, 2002
At the date of observation
Value
Absolute change
Change from the previous value
jan 1, 1991
0.475
+0.475
0.0%
jan 1, 1992
0.448
-0.027
-5.68%
jan 1, 1993
0.496
+0.047
10.53%
jan 1, 1994
0.545
+0.049
9.97%
jan 1, 1995
0.606
+0.061
11.18%
jan 1, 1996
0.602
-0.004
-0.6%
jan 1, 1997
0.61
+0.008
1.33%
jan 1, 1998
0.619
+0.009
1.46%
jan 1, 1999
0.668
+0.048
7.81%
jan 1, 2000
0.723
+0.055
8.25%
jan 1, 2001
0.769
+0.046
6.35%
jan 1, 2002
0.771
+0.002
0.29%
jan 1, 2003
0.762
-0.009
-1.16%
jan 1, 2004
0.718
-0.043
-5.7%
jan 1, 2005
0.653
-0.065
-9.1%
jan 1, 2006
0.597
-0.056
-8.52%
jan 1, 2007
0.576
-0.022
-3.61%
jan 1, 2008
0.565
-0.011
-1.94%
jan 1, 2009
0.5
-0.065
-11.44%
jan 1, 2010
0.45
-0.05
-9.94%
jan 1, 2011
0.426
-0.024
-5.33%
jan 1, 2012
0.391
-0.035
-8.25%
jan 1, 2013
0.383
-0.008
-2.05%
jan 1, 2014
0.396
+0.013
3.4%
jan 1, 2015
0.382
-0.014
-3.52%
jan 1, 2016
0.372
-0.011
-2.78%
Ranking of countries by current statistics by years
