29
/
en
AIzaSyAYiBZKx7MnpbEhh9jyipgxe19OcubqV5w
April 1, 2024
86108
Bhutan
BTN
true
2
1
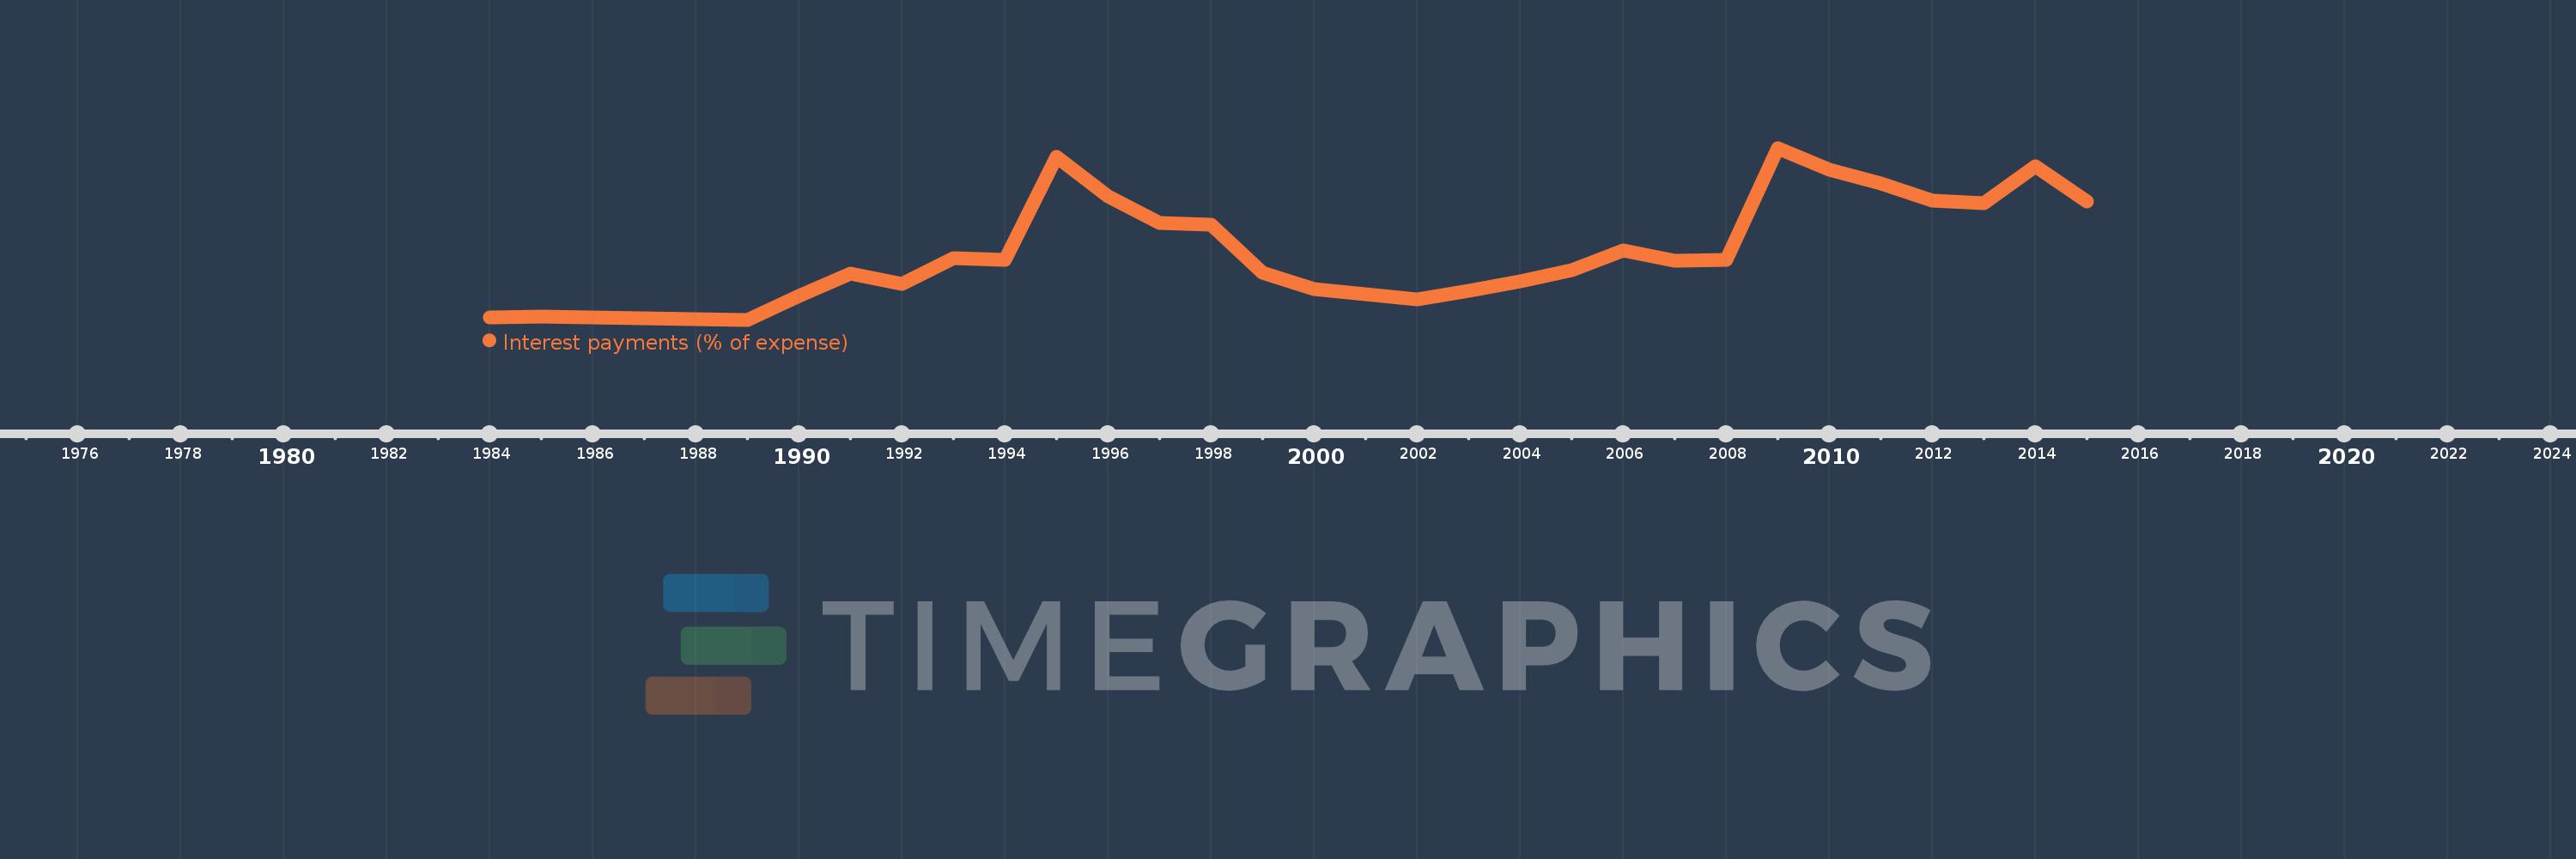
Interest payments (% of expense)
2015,2014,2013,2012,2011,2010,2009,2008,2007,2006,2005,2004,2003,2002,2001,2000,1999,1998,1997,1996,1995,1994,1993,1992,1991,1990,1989,1985,1984
This statistics in other country:
AfghanistanAlbaniaAlgeriaAngolaAntigua and BarbudaArab WorldArmeniaAustraliaAustriaAzerbaijanBahamas, TheBahrainBangladeshBarbadosBelarusBelgiumBelizeBeninBhutanBoliviaBosnia and HerzegovinaBotswanaBrazilBulgariaBurkina FasoBurundiCabo VerdeCambodiaCanadaCaribbean small statesCentral African RepublicCentral Europe and the BalticsChileColombiaCongo, Dem. Rep.Congo, Rep.Costa RicaCote d'IvoireCroatiaCyprusCzech RepublicDenmarkDominicaDominican RepublicEarly-demographic dividendEast Asia & PacificEast Asia & Pacific (excluding high income)East Asia & Pacific (IDA & IBRD countries)Egypt, Arab Rep.El SalvadorEquatorial GuineaEstoniaEthiopiaEuro areaEurope & Central AsiaEurope & Central Asia (excluding high income)Europe & Central Asia (IDA & IBRD countries)European UnionFijiFinlandFranceGambia, TheGeorgiaGermanyGhanaGreeceGrenadaGuatemalaHeavily indebted poor countries (HIPC)High incomeHondurasHong Kong SAR, ChinaHungaryIBRD onlyIcelandIDA & IBRD totalIDA blendIDA onlyIDA totalIndiaIndonesiaIran, Islamic Rep.IraqIrelandIsraelItalyJamaicaJapanJordanKazakhstanKenyaKiribatiKorea, Rep.KuwaitKyrgyz RepublicLao PDRLate-demographic dividendLatin America & Caribbean Latin America & Caribbean (excluding high income)Latin America & the Caribbean (IDA & IBRD countries)LatviaLeast developed countries: UN classificationLebanonLesothoLiberiaLithuaniaLow & middle incomeLow incomeLower middle incomeLuxembourgMacao SAR, ChinaMacedonia, FYRMadagascarMalawiMalaysiaMaldivesMaliMaltaMauritiusMexicoMicronesia, Fed. Sts.Middle East & North AfricaMiddle East & North Africa (excluding high income)Middle East & North Africa (IDA & IBRD countries)Middle incomeMoldovaMongoliaMoroccoMozambiqueNamibiaNepalNetherlandsNew ZealandNicaraguaNigeriaNorth AmericaNorwayOECD membersOmanOther small statesPakistanPanamaPapua New GuineaParaguayPeruPhilippinesPolandPortugalPost-demographic dividendPre-demographic dividendQatarRomaniaRussian FederationRwandaSamoaSan MarinoSao Tome and PrincipeSenegalSerbiaSeychellesSierra LeoneSingaporeSlovak RepublicSloveniaSmall statesSolomon IslandsSouth AfricaSouth AsiaSouth Asia (IDA & IBRD)SpainSri LankaSt. Kitts and NevisSt. LuciaSub-Saharan Africa Sub-Saharan Africa (excluding high income)Sub-Saharan Africa (IDA & IBRD countries)SurinameSwazilandSwedenSwitzerlandSyrian Arab RepublicTajikistanTanzaniaThailandTimor-LesteTogoTrinidad and TobagoTunisiaTurkeyUgandaUkraineUnited KingdomUnited StatesUpper middle incomeUruguayVanuatuVenezuela, RBVietnamWest Bank and GazaWorldYemen, Rep.ZambiaZimbabwe Timeline:
This timeline shows a graph from 1984 to 2015 of Bhutan. No data until 1983. Number of actual observations by date: 29.
Source name:
World Development Indicators
Source organization:
International Monetary Fund, Government Finance Statistics Yearbook and data files.
Categories, topics:
Public Sector
Last updated:
apr 23, 2017
Indicators value changes by year
Maximum:
13.918
jan 1, 2009
At the date of observation
Value
Absolute change
Change from previous value
jan 1, 1984
0.262
+0.262
0.0%
jan 1, 1985
0.326
+0.064
24.34%
jan 1, 1989
0.084
-0.242
-74.34%
jan 1, 1990
2.008
+1.924
2.3K%
jan 1, 1991
3.827
+1.82
90.64%
jan 1, 1992
2.989
-0.838
-21.89%
jan 1, 1993
5.03
+2.041
68.26%
jan 1, 1994
4.906
-0.124
-2.47%
jan 1, 1995
13.172
+8.266
168.51%
jan 1, 1996
10.055
-3.117
-23.66%
jan 1, 1997
7.854
-2.201
-21.89%
jan 1, 1998
7.739
-0.116
-1.47%
jan 1, 1999
3.85
-3.888
-50.24%
jan 1, 2000
2.582
-1.268
-32.94%
jan 1, 2001
2.118
-0.464
-17.98%
jan 1, 2002
1.715
-0.403
-19.05%
jan 1, 2003
2.398
+0.683
39.86%
jan 1, 2004
3.143
+0.745
31.07%
jan 1, 2005
4.072
+0.929
29.55%
jan 1, 2006
5.683
+1.611
39.57%
jan 1, 2007
4.868
-0.815
-14.34%
jan 1, 2008
4.876
+0.007
0.15%
jan 1, 2009
13.918
+9.043
185.47%
jan 1, 2010
12.161
-1.757
-12.62%
jan 1, 2011
11.078
-1.083
-8.9%
jan 1, 2012
9.661
-1.417
-12.79%
jan 1, 2013
9.47
-0.191
-1.98%
jan 1, 2014
12.45
+2.979
31.46%
jan 1, 2015
9.627
-2.823
-22.67%
Ranking of countries by current statistics by years


Comments: