29
/
en
AIzaSyAYiBZKx7MnpbEhh9jyipgxe19OcubqV5w
April 1, 2024
160631
Israel
ISR
true
2
1
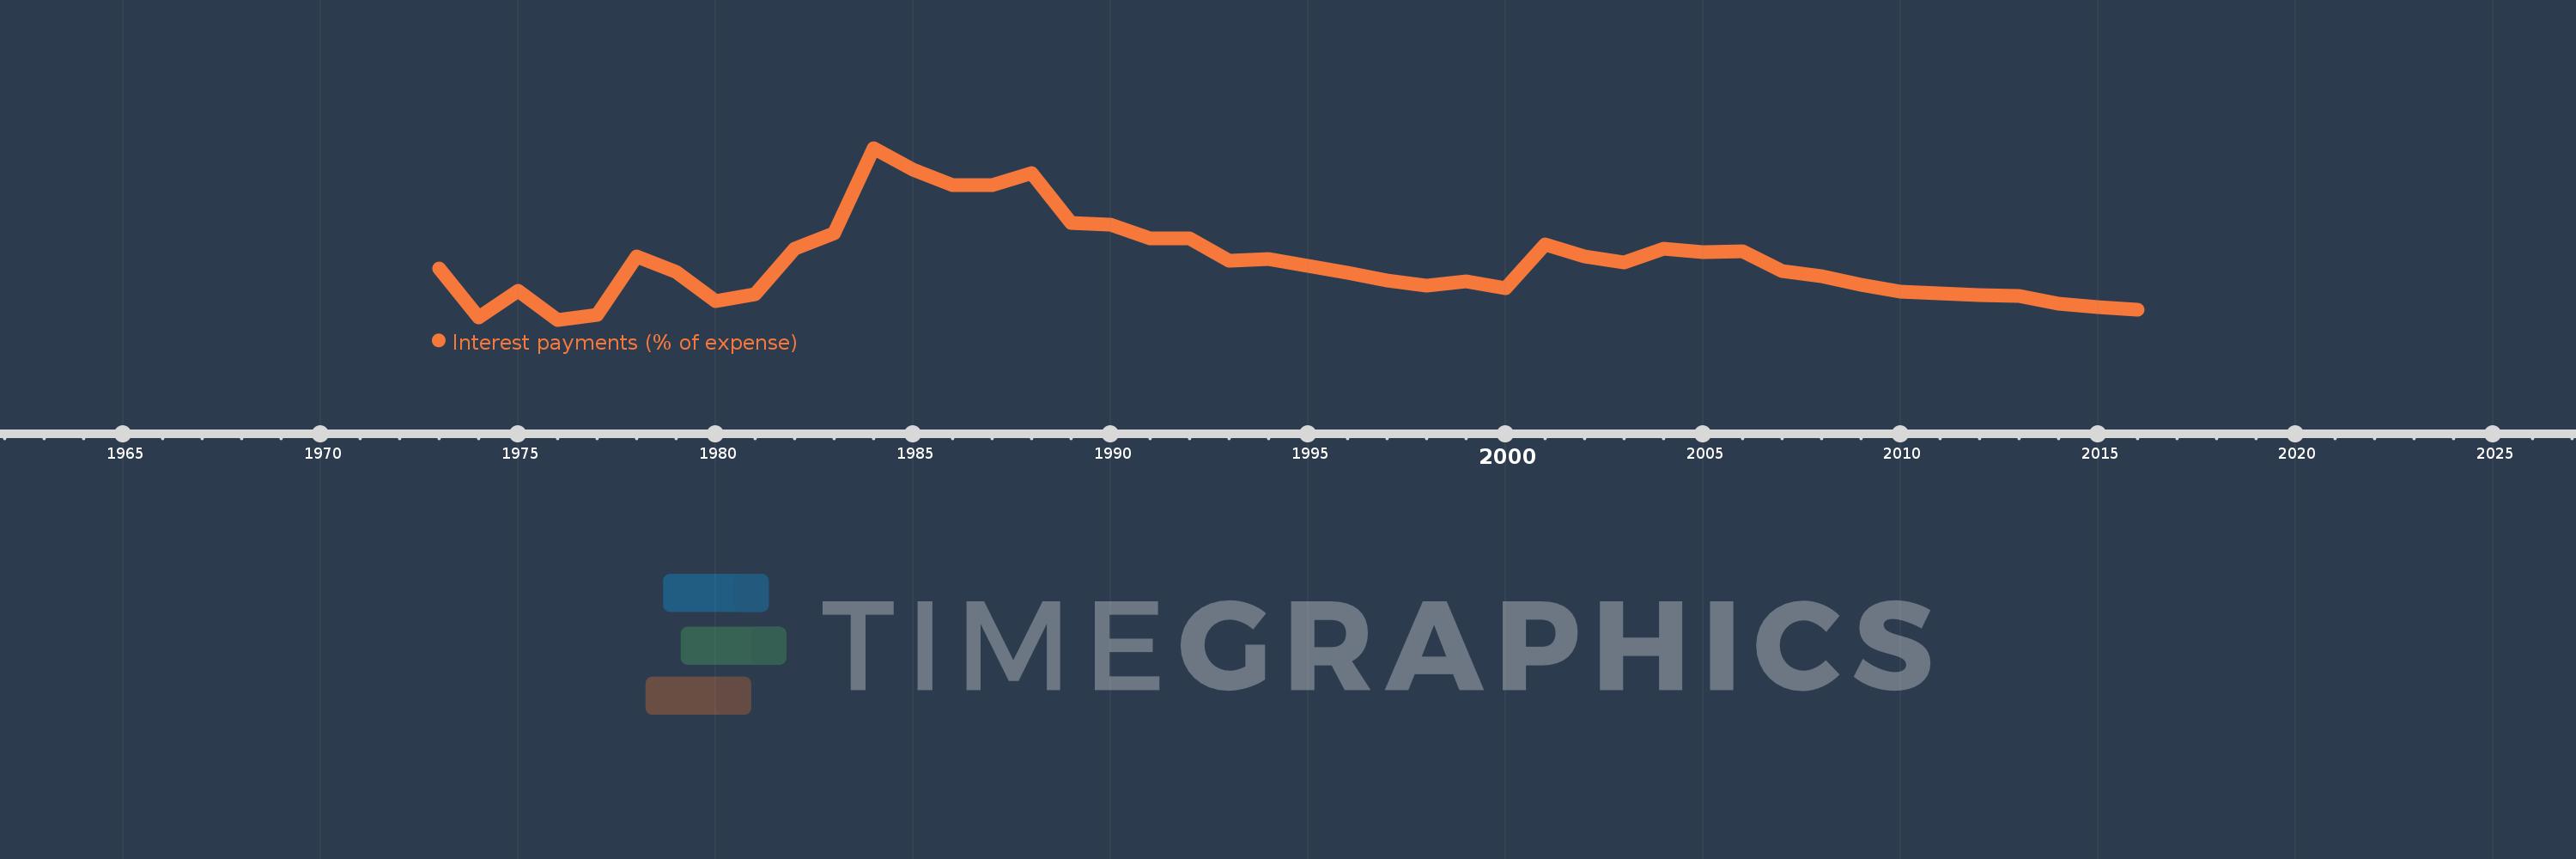
Interest payments (% of expense)
2016,2015,2014,2013,2012,2011,2010,2009,2008,2007,2006,2005,2004,2003,2002,2001,2000,1999,1998,1997,1996,1995,1994,1993,1992,1991,1990,1989,1988,1987,1986,1985,1984,1983,1982,1981,1980,1979,1978,1977,1976,1975,1974,1973
This statistics in other country:
AfghanistanAlbaniaAlgeriaAngolaAntigua and BarbudaArab WorldArmeniaAustraliaAustriaAzerbaijanBahamas, TheBahrainBangladeshBarbadosBelarusBelgiumBelizeBeninBhutanBoliviaBosnia and HerzegovinaBotswanaBrazilBulgariaBurkina FasoBurundiCabo VerdeCambodiaCanadaCaribbean small statesCentral African RepublicCentral Europe and the BalticsChileColombiaCongo, Dem. Rep.Congo, Rep.Costa RicaCote d'IvoireCroatiaCyprusCzech RepublicDenmarkDominicaDominican RepublicEarly-demographic dividendEast Asia & PacificEast Asia & Pacific (excluding high income)East Asia & Pacific (IDA & IBRD countries)Egypt, Arab Rep.El SalvadorEquatorial GuineaEstoniaEthiopiaEuro areaEurope & Central AsiaEurope & Central Asia (excluding high income)Europe & Central Asia (IDA & IBRD countries)European UnionFijiFinlandFranceGambia, TheGeorgiaGermanyGhanaGreeceGrenadaGuatemalaHeavily indebted poor countries (HIPC)High incomeHondurasHong Kong SAR, ChinaHungaryIBRD onlyIcelandIDA & IBRD totalIDA blendIDA onlyIDA totalIndiaIndonesiaIran, Islamic Rep.IraqIrelandIsraelItalyJamaicaJapanJordanKazakhstanKenyaKiribatiKorea, Rep.KuwaitKyrgyz RepublicLao PDRLate-demographic dividendLatin America & Caribbean Latin America & Caribbean (excluding high income)Latin America & the Caribbean (IDA & IBRD countries)LatviaLeast developed countries: UN classificationLebanonLesothoLiberiaLithuaniaLow & middle incomeLow incomeLower middle incomeLuxembourgMacao SAR, ChinaMacedonia, FYRMadagascarMalawiMalaysiaMaldivesMaliMaltaMauritiusMexicoMicronesia, Fed. Sts.Middle East & North AfricaMiddle East & North Africa (excluding high income)Middle East & North Africa (IDA & IBRD countries)Middle incomeMoldovaMongoliaMoroccoMozambiqueNamibiaNepalNetherlandsNew ZealandNicaraguaNigeriaNorth AmericaNorwayOECD membersOmanOther small statesPakistanPanamaPapua New GuineaParaguayPeruPhilippinesPolandPortugalPost-demographic dividendPre-demographic dividendQatarRomaniaRussian FederationRwandaSamoaSan MarinoSao Tome and PrincipeSenegalSerbiaSeychellesSierra LeoneSingaporeSlovak RepublicSloveniaSmall statesSolomon IslandsSouth AfricaSouth AsiaSouth Asia (IDA & IBRD)SpainSri LankaSt. Kitts and NevisSt. LuciaSub-Saharan Africa Sub-Saharan Africa (excluding high income)Sub-Saharan Africa (IDA & IBRD countries)SurinameSwazilandSwedenSwitzerlandSyrian Arab RepublicTajikistanTanzaniaThailandTimor-LesteTogoTrinidad and TobagoTunisiaTurkeyUgandaUkraineUnited KingdomUnited StatesUpper middle incomeUruguayVanuatuVenezuela, RBVietnamWest Bank and GazaWorldYemen, Rep.ZambiaZimbabwe Timeline:
This timeline shows a graph from 1973 to 2016 of Israel. No data until 1972. Number of actual observations by date: 44.
Source name:
World Development Indicators
Source organization:
International Monetary Fund, Government Finance Statistics Yearbook and data files.
Categories, topics:
Public Sector
Last updated:
apr 23, 2017
Indicators value changes by year
Maximum:
29.943
jan 1, 1984
At the date of observation
Value
Absolute change
Change from previous value
jan 1, 1973
14.286
+14.286
0.0%
jan 1, 1974
8.0
-6.286
-44.0%
jan 1, 1975
11.429
+3.429
42.86%
jan 1, 1976
7.692
-3.736
-32.69%
jan 1, 1977
8.333
+0.641
8.33%
jan 1, 1978
15.888
+7.555
90.65%
jan 1, 1979
13.836
-2.051
-12.91%
jan 1, 1980
10.119
-3.717
-26.87%
jan 1, 1981
10.945
+0.826
8.17%
jan 1, 1982
16.937
+5.992
54.74%
jan 1, 1983
18.873
+1.936
11.43%
jan 1, 1984
29.943
+11.07
58.66%
jan 1, 1985
27.113
-2.83
-9.45%
jan 1, 1986
25.137
-1.976
-7.29%
jan 1, 1987
25.141
+0.003
0.01%
jan 1, 1988
26.628
+1.487
5.92%
jan 1, 1989
20.265
-6.363
-23.9%
jan 1, 1990
19.957
-0.308
-1.52%
jan 1, 1991
18.252
-1.705
-8.54%
jan 1, 1992
18.225
-0.028
-0.15%
jan 1, 1993
15.323
-2.902
-15.92%
jan 1, 1994
15.596
+0.273
1.78%
jan 1, 1995
14.654
-0.942
-6.04%
jan 1, 1996
13.829
-0.825
-5.63%
jan 1, 1997
12.821
-1.008
-7.29%
jan 1, 1998
12.081
-0.74
-5.77%
jan 1, 1999
12.72
+0.639
5.29%
jan 1, 2000
11.819
-0.901
-7.08%
jan 1, 2001
17.438
+5.619
47.54%
jan 1, 2002
15.938
-1.5
-8.6%
jan 1, 2003
15.1
-0.838
-5.26%
jan 1, 2004
16.838
+1.738
11.51%
jan 1, 2005
16.501
-0.337
-2.0%
jan 1, 2006
16.579
+0.078
0.47%
jan 1, 2007
14.039
-2.54
-15.32%
jan 1, 2008
13.285
-0.754
-5.37%
jan 1, 2009
12.179
-1.106
-8.33%
jan 1, 2010
11.321
-0.858
-7.05%
jan 1, 2011
11.116
-0.205
-1.81%
jan 1, 2012
10.854
-0.261
-2.35%
jan 1, 2013
10.795
-0.06
-0.55%
jan 1, 2014
9.775
-1.02
-9.44%
jan 1, 2015
9.367
-0.408
-4.18%
jan 1, 2016
9.008
-0.358
-3.83%
Ranking of countries by current statistics by years


Comments: