29
/
en
AIzaSyAYiBZKx7MnpbEhh9jyipgxe19OcubqV5w
April 1, 2024
73124
Australia
AUS
true
2
1
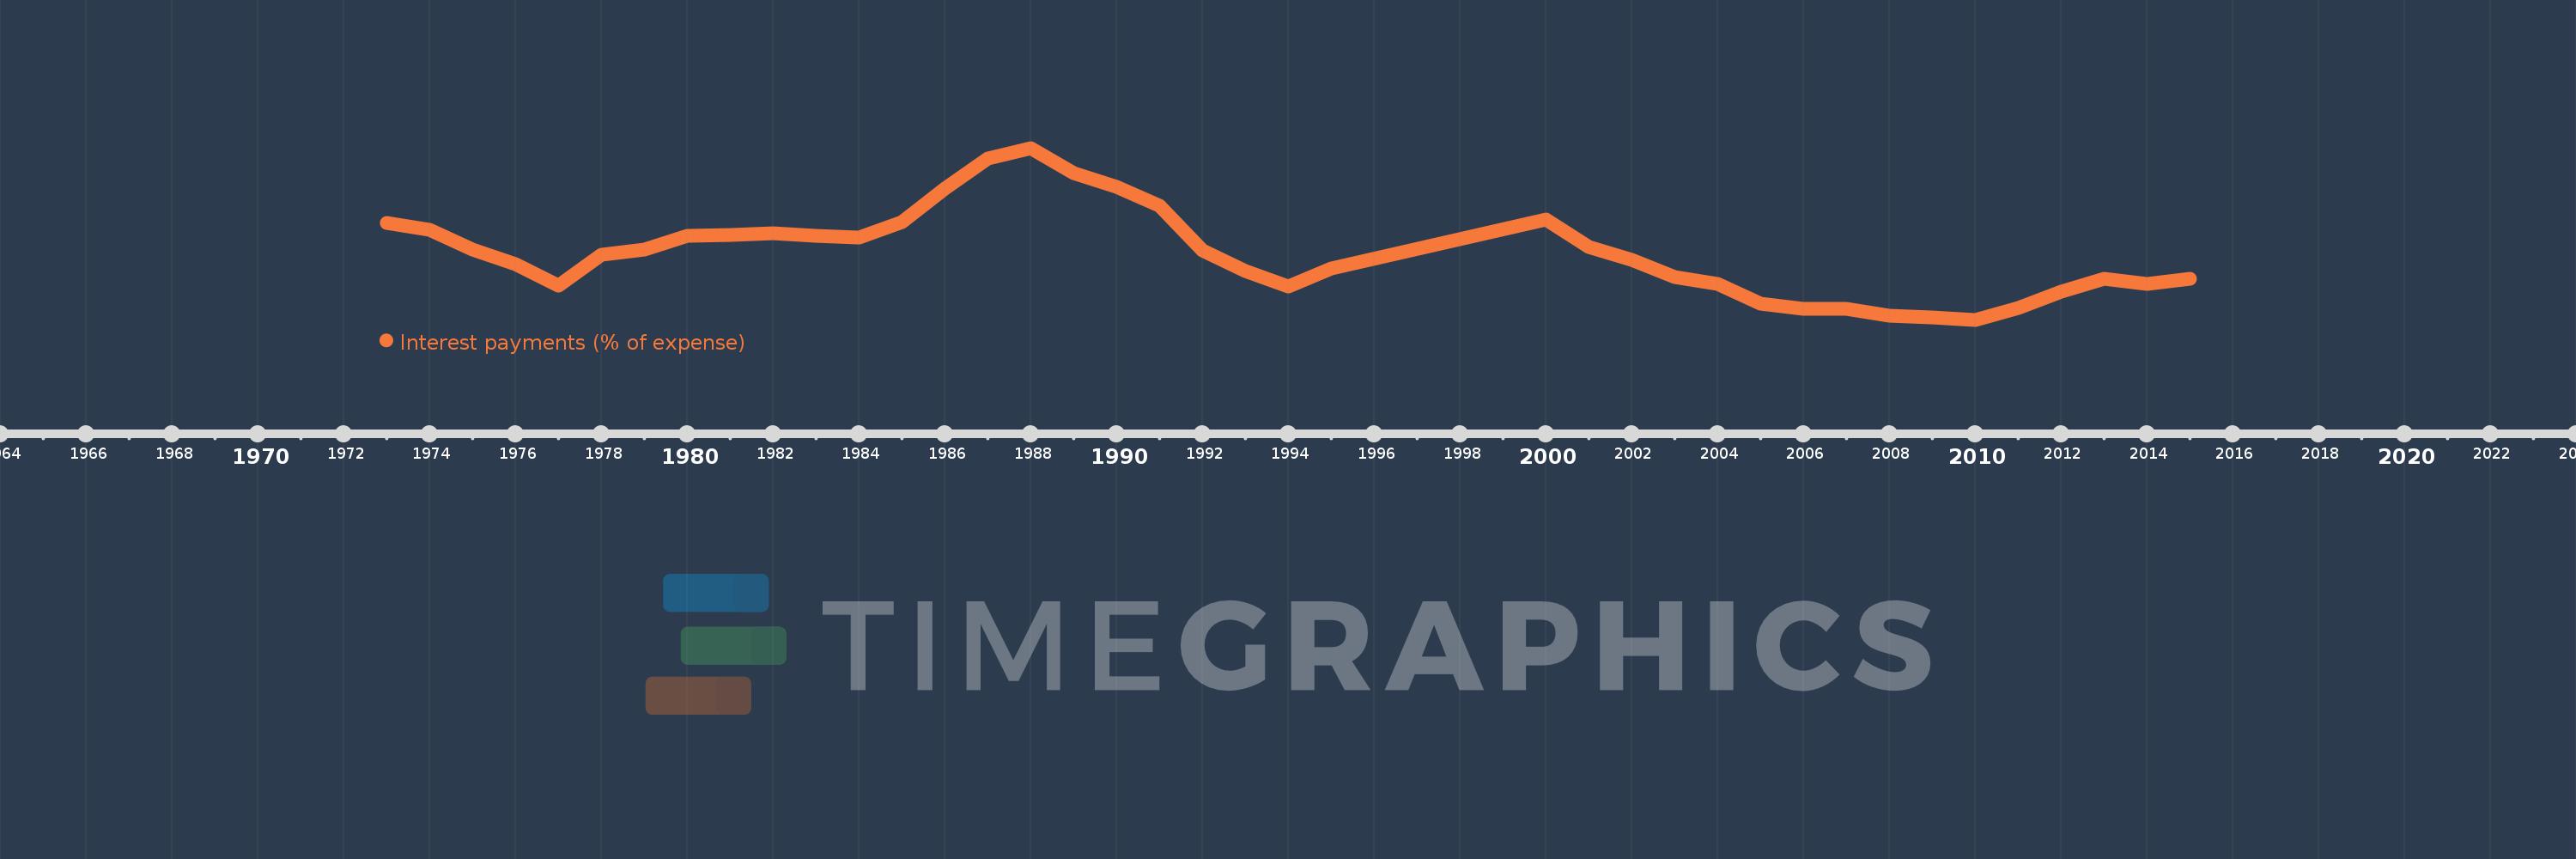
Interest payments (% of expense)
2015,2014,2013,2012,2011,2010,2009,2008,2007,2006,2005,2004,2003,2002,2001,2000,1995,1994,1993,1992,1991,1990,1989,1988,1987,1986,1985,1984,1983,1982,1981,1980,1979,1978,1977,1976,1975,1974,1973
This statistics in other country:
AfghanistanAlbaniaAlgeriaAngolaAntigua and BarbudaArab WorldArmeniaAustraliaAustriaAzerbaijanBahamas, TheBahrainBangladeshBarbadosBelarusBelgiumBelizeBeninBhutanBoliviaBosnia and HerzegovinaBotswanaBrazilBulgariaBurkina FasoBurundiCabo VerdeCambodiaCanadaCaribbean small statesCentral African RepublicCentral Europe and the BalticsChileColombiaCongo, Dem. Rep.Congo, Rep.Costa RicaCote d'IvoireCroatiaCyprusCzech RepublicDenmarkDominicaDominican RepublicEarly-demographic dividendEast Asia & PacificEast Asia & Pacific (excluding high income)East Asia & Pacific (IDA & IBRD countries)Egypt, Arab Rep.El SalvadorEquatorial GuineaEstoniaEthiopiaEuro areaEurope & Central AsiaEurope & Central Asia (excluding high income)Europe & Central Asia (IDA & IBRD countries)European UnionFijiFinlandFranceGambia, TheGeorgiaGermanyGhanaGreeceGrenadaGuatemalaHeavily indebted poor countries (HIPC)High incomeHondurasHong Kong SAR, ChinaHungaryIBRD onlyIcelandIDA & IBRD totalIDA blendIDA onlyIDA totalIndiaIndonesiaIran, Islamic Rep.IraqIrelandIsraelItalyJamaicaJapanJordanKazakhstanKenyaKiribatiKorea, Rep.KuwaitKyrgyz RepublicLao PDRLate-demographic dividendLatin America & Caribbean Latin America & Caribbean (excluding high income)Latin America & the Caribbean (IDA & IBRD countries)LatviaLeast developed countries: UN classificationLebanonLesothoLiberiaLithuaniaLow & middle incomeLow incomeLower middle incomeLuxembourgMacao SAR, ChinaMacedonia, FYRMadagascarMalawiMalaysiaMaldivesMaliMaltaMauritiusMexicoMicronesia, Fed. Sts.Middle East & North AfricaMiddle East & North Africa (excluding high income)Middle East & North Africa (IDA & IBRD countries)Middle incomeMoldovaMongoliaMoroccoMozambiqueNamibiaNepalNetherlandsNew ZealandNicaraguaNigeriaNorth AmericaNorwayOECD membersOmanOther small statesPakistanPanamaPapua New GuineaParaguayPeruPhilippinesPolandPortugalPost-demographic dividendPre-demographic dividendQatarRomaniaRussian FederationRwandaSamoaSan MarinoSao Tome and PrincipeSenegalSerbiaSeychellesSierra LeoneSingaporeSlovak RepublicSloveniaSmall statesSolomon IslandsSouth AfricaSouth AsiaSouth Asia (IDA & IBRD)SpainSri LankaSt. Kitts and NevisSt. LuciaSub-Saharan Africa Sub-Saharan Africa (excluding high income)Sub-Saharan Africa (IDA & IBRD countries)SurinameSwazilandSwedenSwitzerlandSyrian Arab RepublicTajikistanTanzaniaThailandTimor-LesteTogoTrinidad and TobagoTunisiaTurkeyUgandaUkraineUnited KingdomUnited StatesUpper middle incomeUruguayVanuatuVenezuela, RBVietnamWest Bank and GazaWorldYemen, Rep.ZambiaZimbabwe Timeline:
This timeline shows a graph from 1973 to 2015 of Australia. No data until 1972. Number of actual observations by date: 39.
Source name:
World Development Indicators
Source organization:
International Monetary Fund, Government Finance Statistics Yearbook and data files.
Categories, topics:
Public Sector
Last updated:
apr 23, 2017
Indicators value changes by year
Maximum:
10.823
jan 1, 1988
At the date of observation
Value
Absolute change
Change from previous value
jan 1, 1973
7.62
+7.62
0.0%
jan 1, 1974
7.306
-0.314
-4.12%
jan 1, 1975
6.474
-0.832
-11.39%
jan 1, 1976
5.845
-0.629
-9.72%
jan 1, 1977
4.906
-0.939
-16.06%
jan 1, 1978
6.231
+1.325
27.01%
jan 1, 1979
6.449
+0.218
3.49%
jan 1, 1980
7.035
+0.586
9.09%
jan 1, 1981
7.081
+0.046
0.65%
jan 1, 1982
7.159
+0.079
1.11%
jan 1, 1983
7.043
-0.116
-1.63%
jan 1, 1984
6.973
-0.07
-0.99%
jan 1, 1985
7.626
+0.653
9.36%
jan 1, 1986
9.091
+1.465
19.2%
jan 1, 1987
10.373
+1.282
14.11%
jan 1, 1988
10.823
+0.45
4.34%
jan 1, 1989
9.746
-1.077
-9.95%
jan 1, 1990
9.141
-0.605
-6.21%
jan 1, 1991
8.341
-0.8
-8.75%
jan 1, 1992
6.436
-1.905
-22.84%
jan 1, 1993
5.557
-0.879
-13.65%
jan 1, 1994
4.88
-0.677
-12.18%
jan 1, 1995
5.663
+0.782
16.03%
jan 1, 2000
7.752
+2.089
36.89%
jan 1, 2001
6.568
-1.183
-15.26%
jan 1, 2002
6.003
-0.566
-8.61%
jan 1, 2003
5.275
-0.727
-12.12%
jan 1, 2004
4.993
-0.282
-5.35%
jan 1, 2005
4.128
-0.865
-17.32%
jan 1, 2006
3.93
-0.198
-4.79%
jan 1, 2007
3.924
-0.006
-0.16%
jan 1, 2008
3.608
-0.316
-8.05%
jan 1, 2009
3.562
-0.047
-1.29%
jan 1, 2010
3.448
-0.114
-3.19%
jan 1, 2011
3.941
+0.493
14.29%
jan 1, 2012
4.639
+0.698
17.7%
jan 1, 2013
5.201
+0.563
12.14%
jan 1, 2014
4.983
-0.218
-4.2%
jan 1, 2015
5.218
+0.235
4.72%
Ranking of countries by current statistics by years


Comments: