29
/
en
AIzaSyAYiBZKx7MnpbEhh9jyipgxe19OcubqV5w
April 1, 2024
117039
Cyprus
CYP
true
2
1
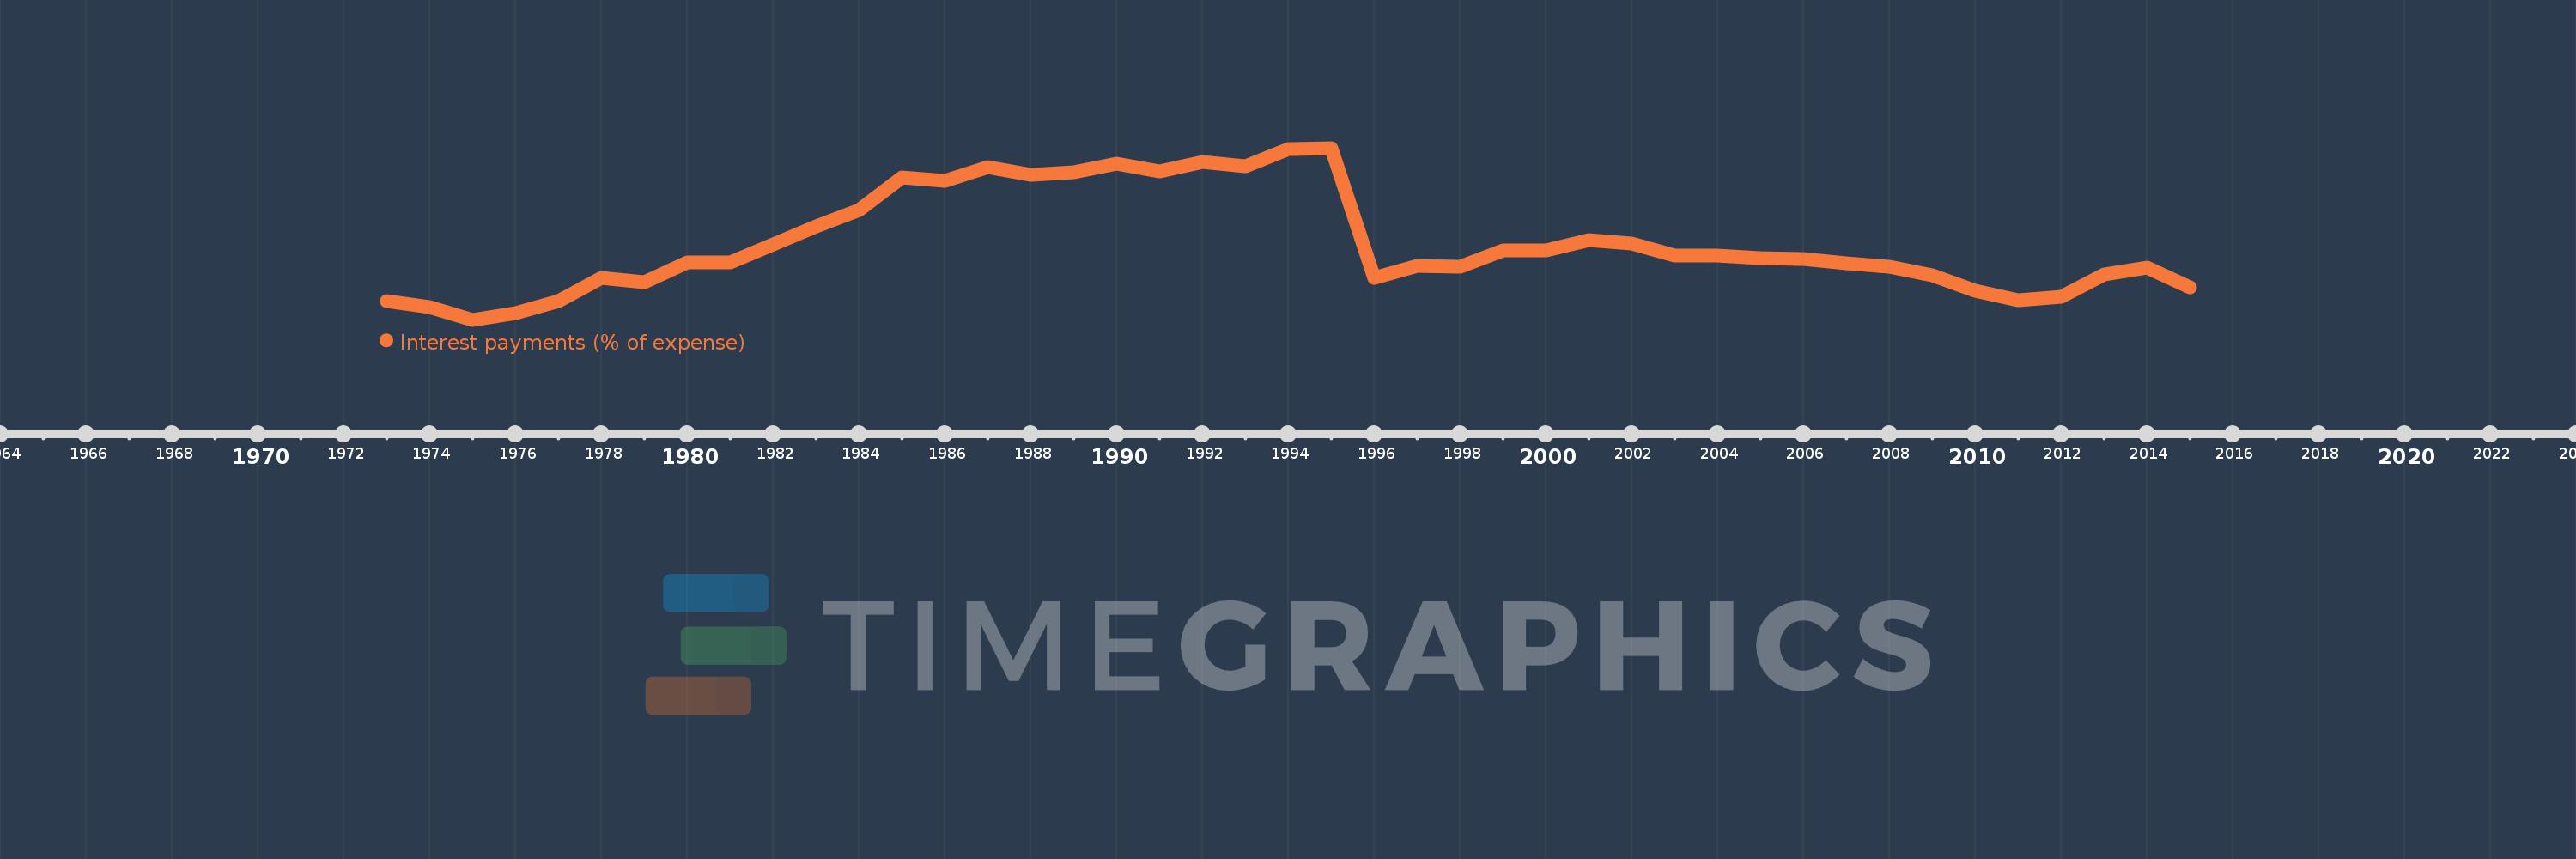
Interest payments (% of expense)
2015,2014,2013,2012,2011,2010,2009,2008,2007,2006,2005,2004,2003,2002,2001,2000,1999,1998,1997,1996,1995,1994,1993,1992,1991,1990,1989,1988,1987,1986,1985,1984,1983,1982,1981,1980,1979,1978,1977,1976,1975,1974,1973
This statistics in other country:
AfghanistanAlbaniaAlgeriaAngolaAntigua and BarbudaArab WorldArmeniaAustraliaAustriaAzerbaijanBahamas, TheBahrainBangladeshBarbadosBelarusBelgiumBelizeBeninBhutanBoliviaBosnia and HerzegovinaBotswanaBrazilBulgariaBurkina FasoBurundiCabo VerdeCambodiaCanadaCaribbean small statesCentral African RepublicCentral Europe and the BalticsChileColombiaCongo, Dem. Rep.Congo, Rep.Costa RicaCote d'IvoireCroatiaCyprusCzech RepublicDenmarkDominicaDominican RepublicEarly-demographic dividendEast Asia & PacificEast Asia & Pacific (excluding high income)East Asia & Pacific (IDA & IBRD countries)Egypt, Arab Rep.El SalvadorEquatorial GuineaEstoniaEthiopiaEuro areaEurope & Central AsiaEurope & Central Asia (excluding high income)Europe & Central Asia (IDA & IBRD countries)European UnionFijiFinlandFranceGambia, TheGeorgiaGermanyGhanaGreeceGrenadaGuatemalaHeavily indebted poor countries (HIPC)High incomeHondurasHong Kong SAR, ChinaHungaryIBRD onlyIcelandIDA & IBRD totalIDA blendIDA onlyIDA totalIndiaIndonesiaIran, Islamic Rep.IraqIrelandIsraelItalyJamaicaJapanJordanKazakhstanKenyaKiribatiKorea, Rep.KuwaitKyrgyz RepublicLao PDRLate-demographic dividendLatin America & Caribbean Latin America & Caribbean (excluding high income)Latin America & the Caribbean (IDA & IBRD countries)LatviaLeast developed countries: UN classificationLebanonLesothoLiberiaLithuaniaLow & middle incomeLow incomeLower middle incomeLuxembourgMacao SAR, ChinaMacedonia, FYRMadagascarMalawiMalaysiaMaldivesMaliMaltaMauritiusMexicoMicronesia, Fed. Sts.Middle East & North AfricaMiddle East & North Africa (excluding high income)Middle East & North Africa (IDA & IBRD countries)Middle incomeMoldovaMongoliaMoroccoMozambiqueNamibiaNepalNetherlandsNew ZealandNicaraguaNigeriaNorth AmericaNorwayOECD membersOmanOther small statesPakistanPanamaPapua New GuineaParaguayPeruPhilippinesPolandPortugalPost-demographic dividendPre-demographic dividendQatarRomaniaRussian FederationRwandaSamoaSan MarinoSao Tome and PrincipeSenegalSerbiaSeychellesSierra LeoneSingaporeSlovak RepublicSloveniaSmall statesSolomon IslandsSouth AfricaSouth AsiaSouth Asia (IDA & IBRD)SpainSri LankaSt. Kitts and NevisSt. LuciaSub-Saharan Africa Sub-Saharan Africa (excluding high income)Sub-Saharan Africa (IDA & IBRD countries)SurinameSwazilandSwedenSwitzerlandSyrian Arab RepublicTajikistanTanzaniaThailandTimor-LesteTogoTrinidad and TobagoTunisiaTurkeyUgandaUkraineUnited KingdomUnited StatesUpper middle incomeUruguayVanuatuVenezuela, RBVietnamWest Bank and GazaWorldYemen, Rep.ZambiaZimbabwe Timeline:
This timeline shows a graph from 1973 to 2015 of Cyprus. No data until 1972. Number of actual observations by date: 43.
Source name:
World Development Indicators
Source organization:
International Monetary Fund, Government Finance Statistics Yearbook and data files.
Categories, topics:
Public Sector
Last updated:
apr 23, 2017
Indicators value changes by year
Maximum:
17.033
jan 1, 1995
At the date of observation
Value
Absolute change
Change from previous value
jan 1, 1973
4.802
+4.802
0.0%
jan 1, 1974
4.333
-0.469
-9.76%
jan 1, 1975
3.321
-1.012
-23.36%
jan 1, 1976
3.825
+0.504
15.17%
jan 1, 1977
4.779
+0.954
24.95%
jan 1, 1978
6.662
+1.883
39.4%
jan 1, 1979
6.328
-0.334
-5.01%
jan 1, 1980
7.896
+1.568
24.79%
jan 1, 1981
7.883
-0.013
-0.17%
jan 1, 1982
9.304
+1.421
18.02%
jan 1, 1983
10.781
+1.477
15.87%
jan 1, 1984
12.083
+1.302
12.08%
jan 1, 1985
14.712
+2.629
21.76%
jan 1, 1986
14.441
-0.272
-1.85%
jan 1, 1987
15.511
+1.071
7.41%
jan 1, 1988
14.872
-0.64
-4.12%
jan 1, 1989
15.1
+0.228
1.53%
jan 1, 1990
15.777
+0.677
4.48%
jan 1, 1991
15.132
-0.645
-4.09%
jan 1, 1992
15.922
+0.79
5.22%
jan 1, 1993
15.567
-0.355
-2.23%
jan 1, 1994
16.921
+1.353
8.69%
jan 1, 1995
17.033
+0.112
0.66%
jan 1, 1996
6.662
-10.371
-60.89%
jan 1, 1997
7.645
+0.983
14.76%
jan 1, 1998
7.549
-0.096
-1.25%
jan 1, 1999
8.829
+1.28
16.95%
jan 1, 2000
8.833
+0.004
0.04%
jan 1, 2001
9.678
+0.846
9.57%
jan 1, 2002
9.4
-0.279
-2.88%
jan 1, 2003
8.447
-0.953
-10.14%
jan 1, 2004
8.446
-0.001
-0.01%
jan 1, 2005
8.22
-0.227
-2.68%
jan 1, 2006
8.189
-0.03
-0.37%
jan 1, 2007
7.821
-0.368
-4.49%
jan 1, 2008
7.542
-0.279
-3.57%
jan 1, 2009
6.859
-0.684
-9.06%
jan 1, 2010
5.627
-1.232
-17.96%
jan 1, 2011
4.902
-0.725
-12.88%
jan 1, 2012
5.158
+0.256
5.22%
jan 1, 2013
6.956
+1.797
34.84%
jan 1, 2014
7.504
+0.548
7.88%
jan 1, 2015
5.885
-1.619
-21.57%
Ranking of countries by current statistics by years


Comments: