29
/
en
AIzaSyAYiBZKx7MnpbEhh9jyipgxe19OcubqV5w
April 1, 2024
134259
France
FRA
true
2
1
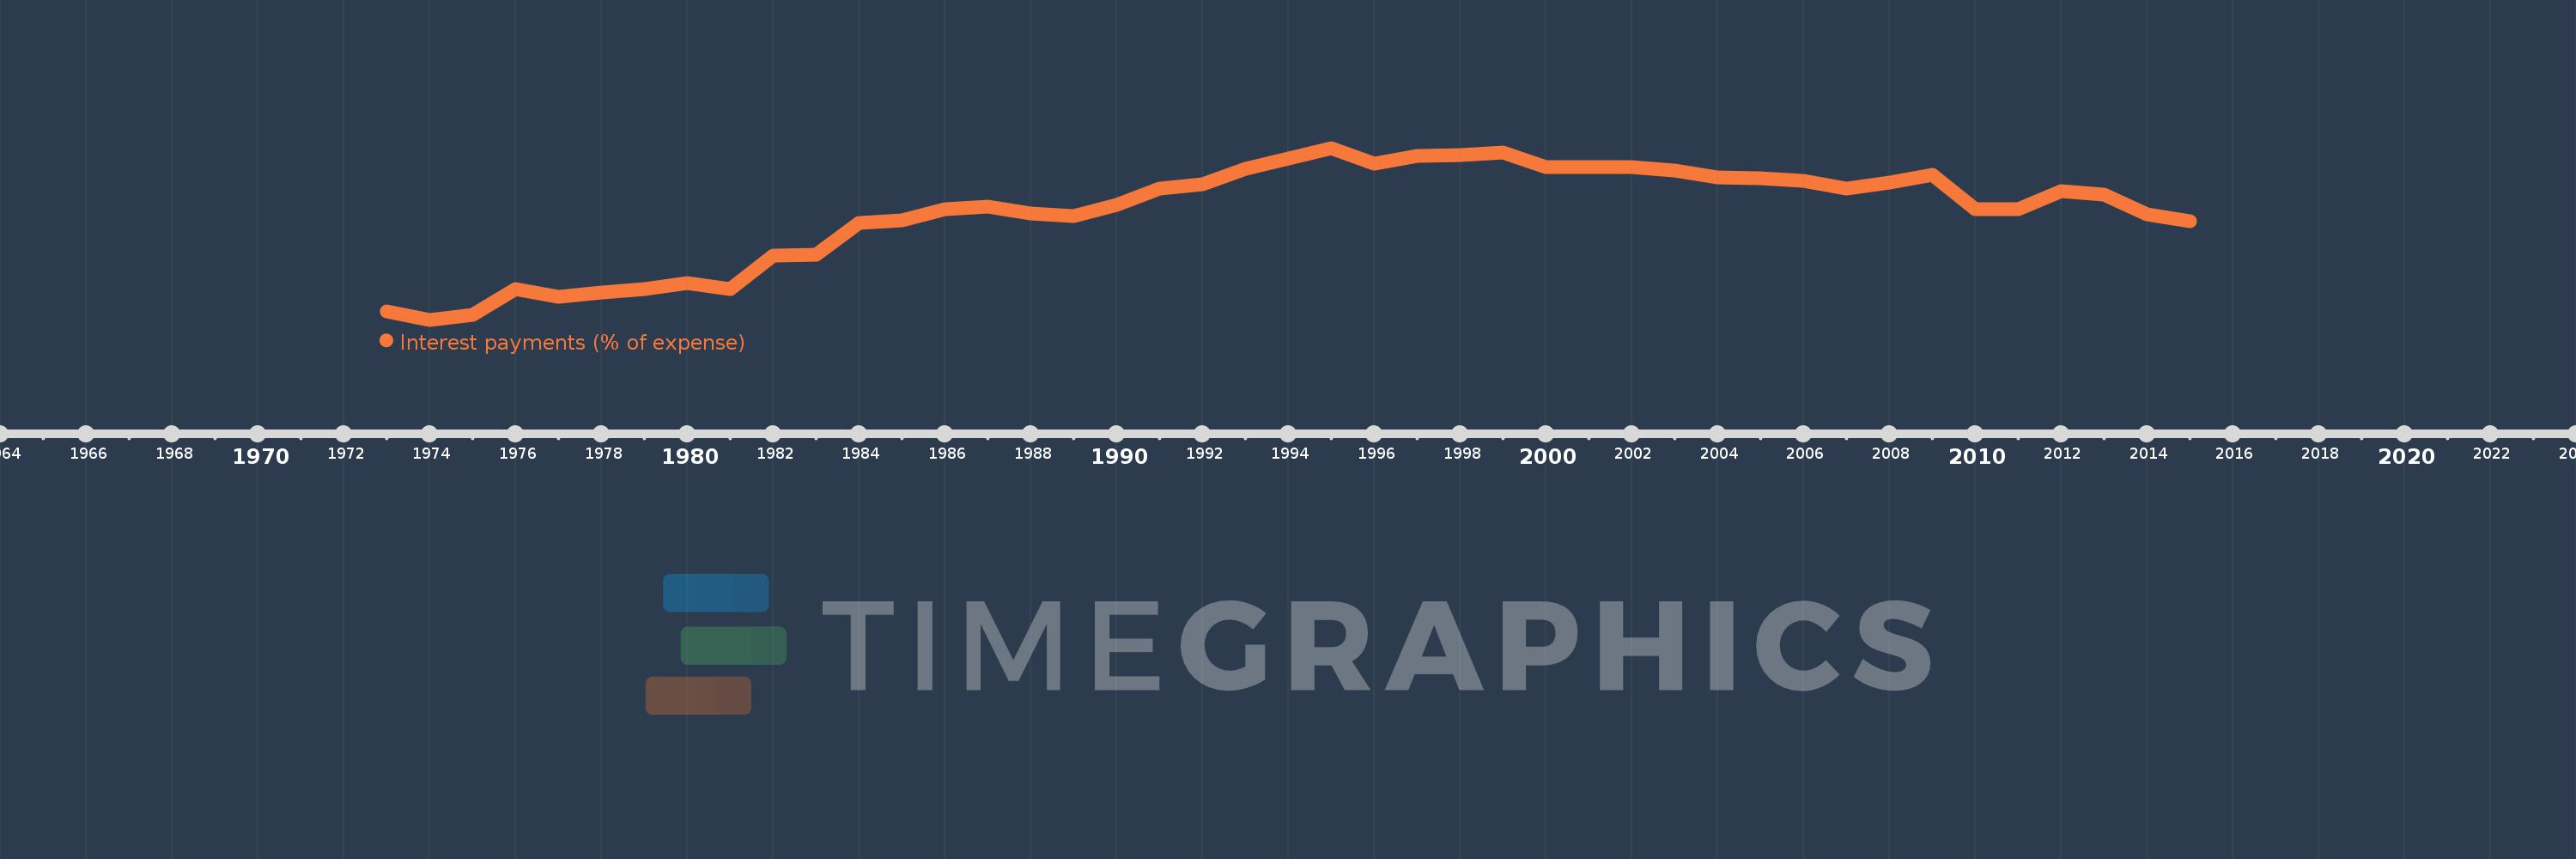
Interest payments (% of expense)
2015,2014,2013,2012,2011,2010,2009,2008,2007,2006,2005,2004,2003,2002,2001,2000,1999,1998,1997,1996,1995,1994,1993,1992,1991,1990,1989,1988,1987,1986,1985,1984,1983,1982,1981,1980,1979,1978,1977,1976,1975,1974,1973
This statistics in other country:
AfghanistanAlbaniaAlgeriaAngolaAntigua and BarbudaArab WorldArmeniaAustraliaAustriaAzerbaijanBahamas, TheBahrainBangladeshBarbadosBelarusBelgiumBelizeBeninBhutanBoliviaBosnia and HerzegovinaBotswanaBrazilBulgariaBurkina FasoBurundiCabo VerdeCambodiaCanadaCaribbean small statesCentral African RepublicCentral Europe and the BalticsChileColombiaCongo, Dem. Rep.Congo, Rep.Costa RicaCote d'IvoireCroatiaCyprusCzech RepublicDenmarkDominicaDominican RepublicEarly-demographic dividendEast Asia & PacificEast Asia & Pacific (excluding high income)East Asia & Pacific (IDA & IBRD countries)Egypt, Arab Rep.El SalvadorEquatorial GuineaEstoniaEthiopiaEuro areaEurope & Central AsiaEurope & Central Asia (excluding high income)Europe & Central Asia (IDA & IBRD countries)European UnionFijiFinlandFranceGambia, TheGeorgiaGermanyGhanaGreeceGrenadaGuatemalaHeavily indebted poor countries (HIPC)High incomeHondurasHong Kong SAR, ChinaHungaryIBRD onlyIcelandIDA & IBRD totalIDA blendIDA onlyIDA totalIndiaIndonesiaIran, Islamic Rep.IraqIrelandIsraelItalyJamaicaJapanJordanKazakhstanKenyaKiribatiKorea, Rep.KuwaitKyrgyz RepublicLao PDRLate-demographic dividendLatin America & Caribbean Latin America & Caribbean (excluding high income)Latin America & the Caribbean (IDA & IBRD countries)LatviaLeast developed countries: UN classificationLebanonLesothoLiberiaLithuaniaLow & middle incomeLow incomeLower middle incomeLuxembourgMacao SAR, ChinaMacedonia, FYRMadagascarMalawiMalaysiaMaldivesMaliMaltaMauritiusMexicoMicronesia, Fed. Sts.Middle East & North AfricaMiddle East & North Africa (excluding high income)Middle East & North Africa (IDA & IBRD countries)Middle incomeMoldovaMongoliaMoroccoMozambiqueNamibiaNepalNetherlandsNew ZealandNicaraguaNigeriaNorth AmericaNorwayOECD membersOmanOther small statesPakistanPanamaPapua New GuineaParaguayPeruPhilippinesPolandPortugalPost-demographic dividendPre-demographic dividendQatarRomaniaRussian FederationRwandaSamoaSan MarinoSao Tome and PrincipeSenegalSerbiaSeychellesSierra LeoneSingaporeSlovak RepublicSloveniaSmall statesSolomon IslandsSouth AfricaSouth AsiaSouth Asia (IDA & IBRD)SpainSri LankaSt. Kitts and NevisSt. LuciaSub-Saharan Africa Sub-Saharan Africa (excluding high income)Sub-Saharan Africa (IDA & IBRD countries)SurinameSwazilandSwedenSwitzerlandSyrian Arab RepublicTajikistanTanzaniaThailandTimor-LesteTogoTrinidad and TobagoTunisiaTurkeyUgandaUkraineUnited KingdomUnited StatesUpper middle incomeUruguayVanuatuVenezuela, RBVietnamWest Bank and GazaWorldYemen, Rep.ZambiaZimbabwe Timeline:
This timeline shows a graph from 1973 to 2015 of France. No data until 1972. Number of actual observations by date: 43.
Source name:
World Development Indicators
Source organization:
International Monetary Fund, Government Finance Statistics Yearbook and data files.
Categories, topics:
Public Sector
Last updated:
apr 23, 2017
Indicators value changes by year
At the date of observation
Value
Absolute change
Change from previous value
jan 1, 1973
1.494
+1.494
0.0%
jan 1, 1974
1.245
-0.249
-16.67%
jan 1, 1975
1.381
+0.137
10.99%
jan 1, 1976
2.156
+0.775
56.1%
jan 1, 1977
1.921
-0.235
-10.91%
jan 1, 1978
2.053
+0.132
6.85%
jan 1, 1979
2.168
+0.116
5.63%
jan 1, 1980
2.34
+0.172
7.94%
jan 1, 1981
2.175
-0.166
-7.08%
jan 1, 1982
3.176
+1.001
46.04%
jan 1, 1983
3.179
+0.003
0.11%
jan 1, 1984
4.132
+0.952
29.95%
jan 1, 1985
4.226
+0.095
2.29%
jan 1, 1986
4.545
+0.318
7.53%
jan 1, 1987
4.627
+0.082
1.81%
jan 1, 1988
4.416
-0.21
-4.55%
jan 1, 1989
4.335
-0.082
-1.85%
jan 1, 1990
4.674
+0.34
7.84%
jan 1, 1991
5.183
+0.508
10.87%
jan 1, 1992
5.309
+0.127
2.44%
jan 1, 1993
5.767
+0.458
8.62%
jan 1, 1994
6.057
+0.29
5.02%
jan 1, 1995
6.386
+0.33
5.45%
jan 1, 1996
5.912
-0.475
-7.43%
jan 1, 1997
6.142
+0.231
3.9%
jan 1, 1998
6.177
+0.035
0.56%
jan 1, 1999
6.25
+0.073
1.18%
jan 1, 2000
5.818
-0.431
-6.9%
jan 1, 2001
5.81
-0.008
-0.14%
jan 1, 2002
5.804
-0.006
-0.11%
jan 1, 2003
5.709
-0.094
-1.63%
jan 1, 2004
5.496
-0.213
-3.74%
jan 1, 2005
5.48
-0.016
-0.29%
jan 1, 2006
5.399
-0.081
-1.48%
jan 1, 2007
5.178
-0.221
-4.09%
jan 1, 2008
5.348
+0.169
3.27%
jan 1, 2009
5.585
+0.237
4.43%
jan 1, 2010
4.559
-1.025
-18.36%
jan 1, 2011
4.541
-0.018
-0.41%
jan 1, 2012
5.094
+0.554
12.19%
jan 1, 2013
4.989
-0.105
-2.06%
jan 1, 2014
4.405
-0.584
-11.7%
jan 1, 2015
4.192
-0.213
-4.84%
Ranking of countries by current statistics by years


Comments: