29
/
en
AIzaSyAYiBZKx7MnpbEhh9jyipgxe19OcubqV5w
April 1, 2024
276797
United States
USA
true
2
1
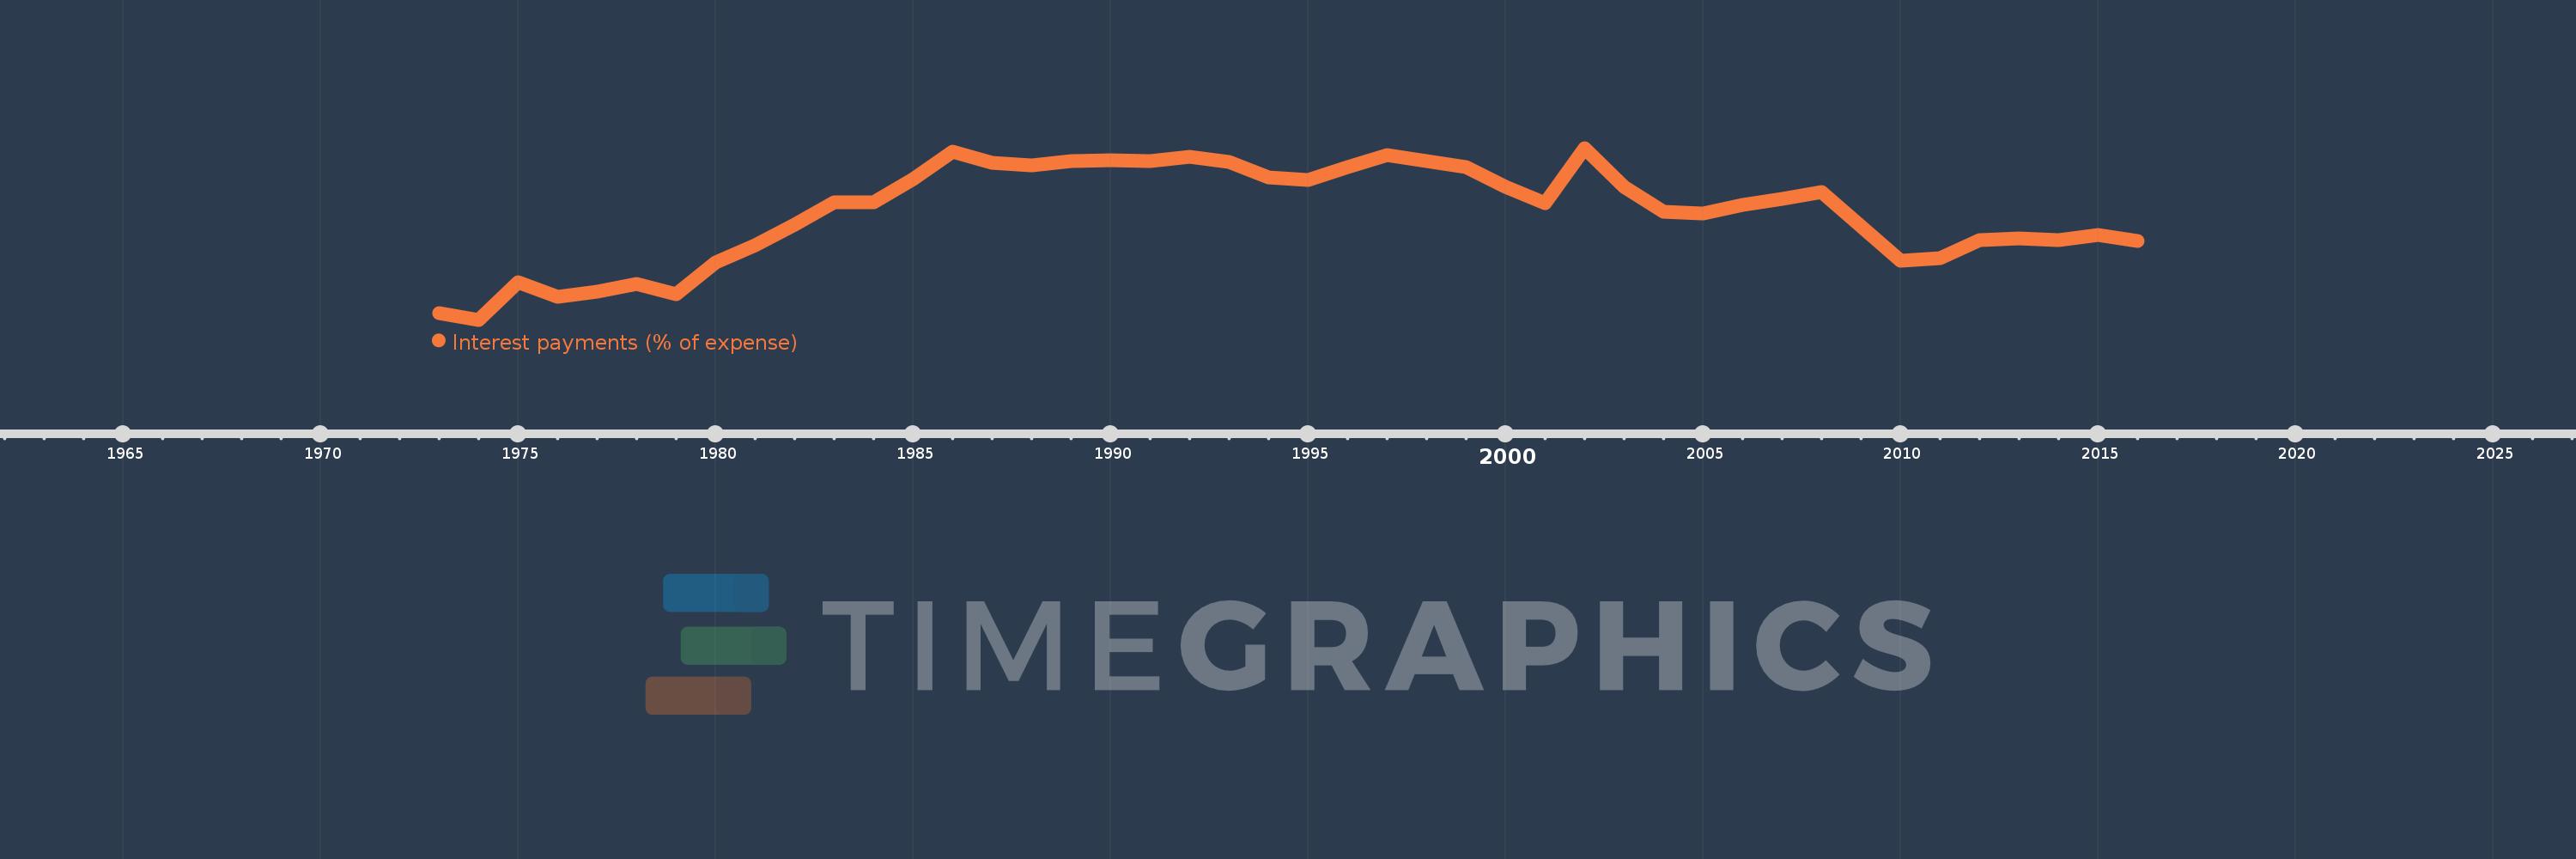
Interest payments (% of expense)
2016,2015,2014,2013,2012,2011,2010,2009,2008,2007,2006,2005,2004,2003,2002,2001,2000,1999,1998,1997,1996,1995,1994,1993,1992,1991,1990,1989,1988,1987,1986,1985,1984,1983,1982,1981,1980,1979,1978,1977,1976,1975,1974,1973
This statistics in other country:
AfghanistanAlbaniaAlgeriaAngolaAntigua and BarbudaArab WorldArmeniaAustraliaAustriaAzerbaijanBahamas, TheBahrainBangladeshBarbadosBelarusBelgiumBelizeBeninBhutanBoliviaBosnia and HerzegovinaBotswanaBrazilBulgariaBurkina FasoBurundiCabo VerdeCambodiaCanadaCaribbean small statesCentral African RepublicCentral Europe and the BalticsChileColombiaCongo, Dem. Rep.Congo, Rep.Costa RicaCote d'IvoireCroatiaCyprusCzech RepublicDenmarkDominicaDominican RepublicEarly-demographic dividendEast Asia & PacificEast Asia & Pacific (excluding high income)East Asia & Pacific (IDA & IBRD countries)Egypt, Arab Rep.El SalvadorEquatorial GuineaEstoniaEthiopiaEuro areaEurope & Central AsiaEurope & Central Asia (excluding high income)Europe & Central Asia (IDA & IBRD countries)European UnionFijiFinlandFranceGambia, TheGeorgiaGermanyGhanaGreeceGrenadaGuatemalaHeavily indebted poor countries (HIPC)High incomeHondurasHong Kong SAR, ChinaHungaryIBRD onlyIcelandIDA & IBRD totalIDA blendIDA onlyIDA totalIndiaIndonesiaIran, Islamic Rep.IraqIrelandIsraelItalyJamaicaJapanJordanKazakhstanKenyaKiribatiKorea, Rep.KuwaitKyrgyz RepublicLao PDRLate-demographic dividendLatin America & Caribbean Latin America & Caribbean (excluding high income)Latin America & the Caribbean (IDA & IBRD countries)LatviaLeast developed countries: UN classificationLebanonLesothoLiberiaLithuaniaLow & middle incomeLow incomeLower middle incomeLuxembourgMacao SAR, ChinaMacedonia, FYRMadagascarMalawiMalaysiaMaldivesMaliMaltaMauritiusMexicoMicronesia, Fed. Sts.Middle East & North AfricaMiddle East & North Africa (excluding high income)Middle East & North Africa (IDA & IBRD countries)Middle incomeMoldovaMongoliaMoroccoMozambiqueNamibiaNepalNetherlandsNew ZealandNicaraguaNigeriaNorth AmericaNorwayOECD membersOmanOther small statesPakistanPanamaPapua New GuineaParaguayPeruPhilippinesPolandPortugalPost-demographic dividendPre-demographic dividendQatarRomaniaRussian FederationRwandaSamoaSan MarinoSao Tome and PrincipeSenegalSerbiaSeychellesSierra LeoneSingaporeSlovak RepublicSloveniaSmall statesSolomon IslandsSouth AfricaSouth AsiaSouth Asia (IDA & IBRD)SpainSri LankaSt. Kitts and NevisSt. LuciaSub-Saharan Africa Sub-Saharan Africa (excluding high income)Sub-Saharan Africa (IDA & IBRD countries)SurinameSwazilandSwedenSwitzerlandSyrian Arab RepublicTajikistanTanzaniaThailandTimor-LesteTogoTrinidad and TobagoTunisiaTurkeyUgandaUkraineUnited KingdomUnited StatesUpper middle incomeUruguayVanuatuVenezuela, RBVietnamWest Bank and GazaWorldYemen, Rep.ZambiaZimbabwe Timeline:
This timeline shows a graph from 1973 to 2016 of United States. No data until 1972. Number of actual observations by date: 44.
Source name:
World Development Indicators
Source organization:
International Monetary Fund, Government Finance Statistics Yearbook and data files.
Categories, topics:
Public Sector
Last updated:
apr 23, 2017
Indicators value changes by year
Maximum:
16.046
jan 1, 2002
At the date of observation
Value
Absolute change
Change from previous value
jan 1, 1973
6.51
+6.51
0.0%
jan 1, 1974
6.147
-0.363
-5.57%
jan 1, 1975
8.323
+2.177
35.41%
jan 1, 1976
7.483
-0.84
-10.09%
jan 1, 1977
7.764
+0.28
3.75%
jan 1, 1978
8.194
+0.43
5.54%
jan 1, 1979
7.623
-0.571
-6.97%
jan 1, 1980
9.469
+1.846
24.22%
jan 1, 1981
10.446
+0.978
10.32%
jan 1, 1982
11.649
+1.203
11.51%
jan 1, 1983
12.895
+1.247
10.7%
jan 1, 1984
12.91
+0.015
0.11%
jan 1, 1985
14.256
+1.346
10.42%
jan 1, 1986
15.818
+1.562
10.96%
jan 1, 1987
15.195
-0.622
-3.93%
jan 1, 1988
15.055
-0.14
-0.92%
jan 1, 1989
15.276
+0.221
1.47%
jan 1, 1990
15.361
+0.085
0.55%
jan 1, 1991
15.272
-0.089
-0.58%
jan 1, 1992
15.537
+0.264
1.73%
jan 1, 1993
15.223
-0.314
-2.02%
jan 1, 1994
14.364
-0.859
-5.64%
jan 1, 1995
14.186
-0.177
-1.23%
jan 1, 1996
14.928
+0.742
5.23%
jan 1, 1997
15.623
+0.695
4.66%
jan 1, 1998
15.299
-0.324
-2.08%
jan 1, 1999
14.923
-0.375
-2.45%
jan 1, 2000
13.825
-1.098
-7.36%
jan 1, 2001
12.862
-0.963
-6.96%
jan 1, 2002
16.046
+3.184
24.75%
jan 1, 2003
13.79
-2.256
-14.06%
jan 1, 2004
12.367
-1.423
-10.32%
jan 1, 2005
12.26
-0.107
-0.87%
jan 1, 2006
12.741
+0.481
3.93%
jan 1, 2007
13.09
+0.349
2.74%
jan 1, 2008
13.52
+0.431
3.29%
jan 1, 2009
11.519
-2.001
-14.8%
jan 1, 2010
9.551
-1.968
-17.09%
jan 1, 2011
9.697
+0.147
1.53%
jan 1, 2012
10.755
+1.057
10.9%
jan 1, 2013
10.85
+0.096
0.89%
jan 1, 2014
10.755
-0.095
-0.88%
jan 1, 2015
11.042
+0.287
2.67%
jan 1, 2016
10.676
-0.366
-3.31%
Ranking of countries by current statistics by years


Comments: