29
/
en
AIzaSyAYiBZKx7MnpbEhh9jyipgxe19OcubqV5w
April 1, 2024
245759
South Africa
ZAF
true
2
1
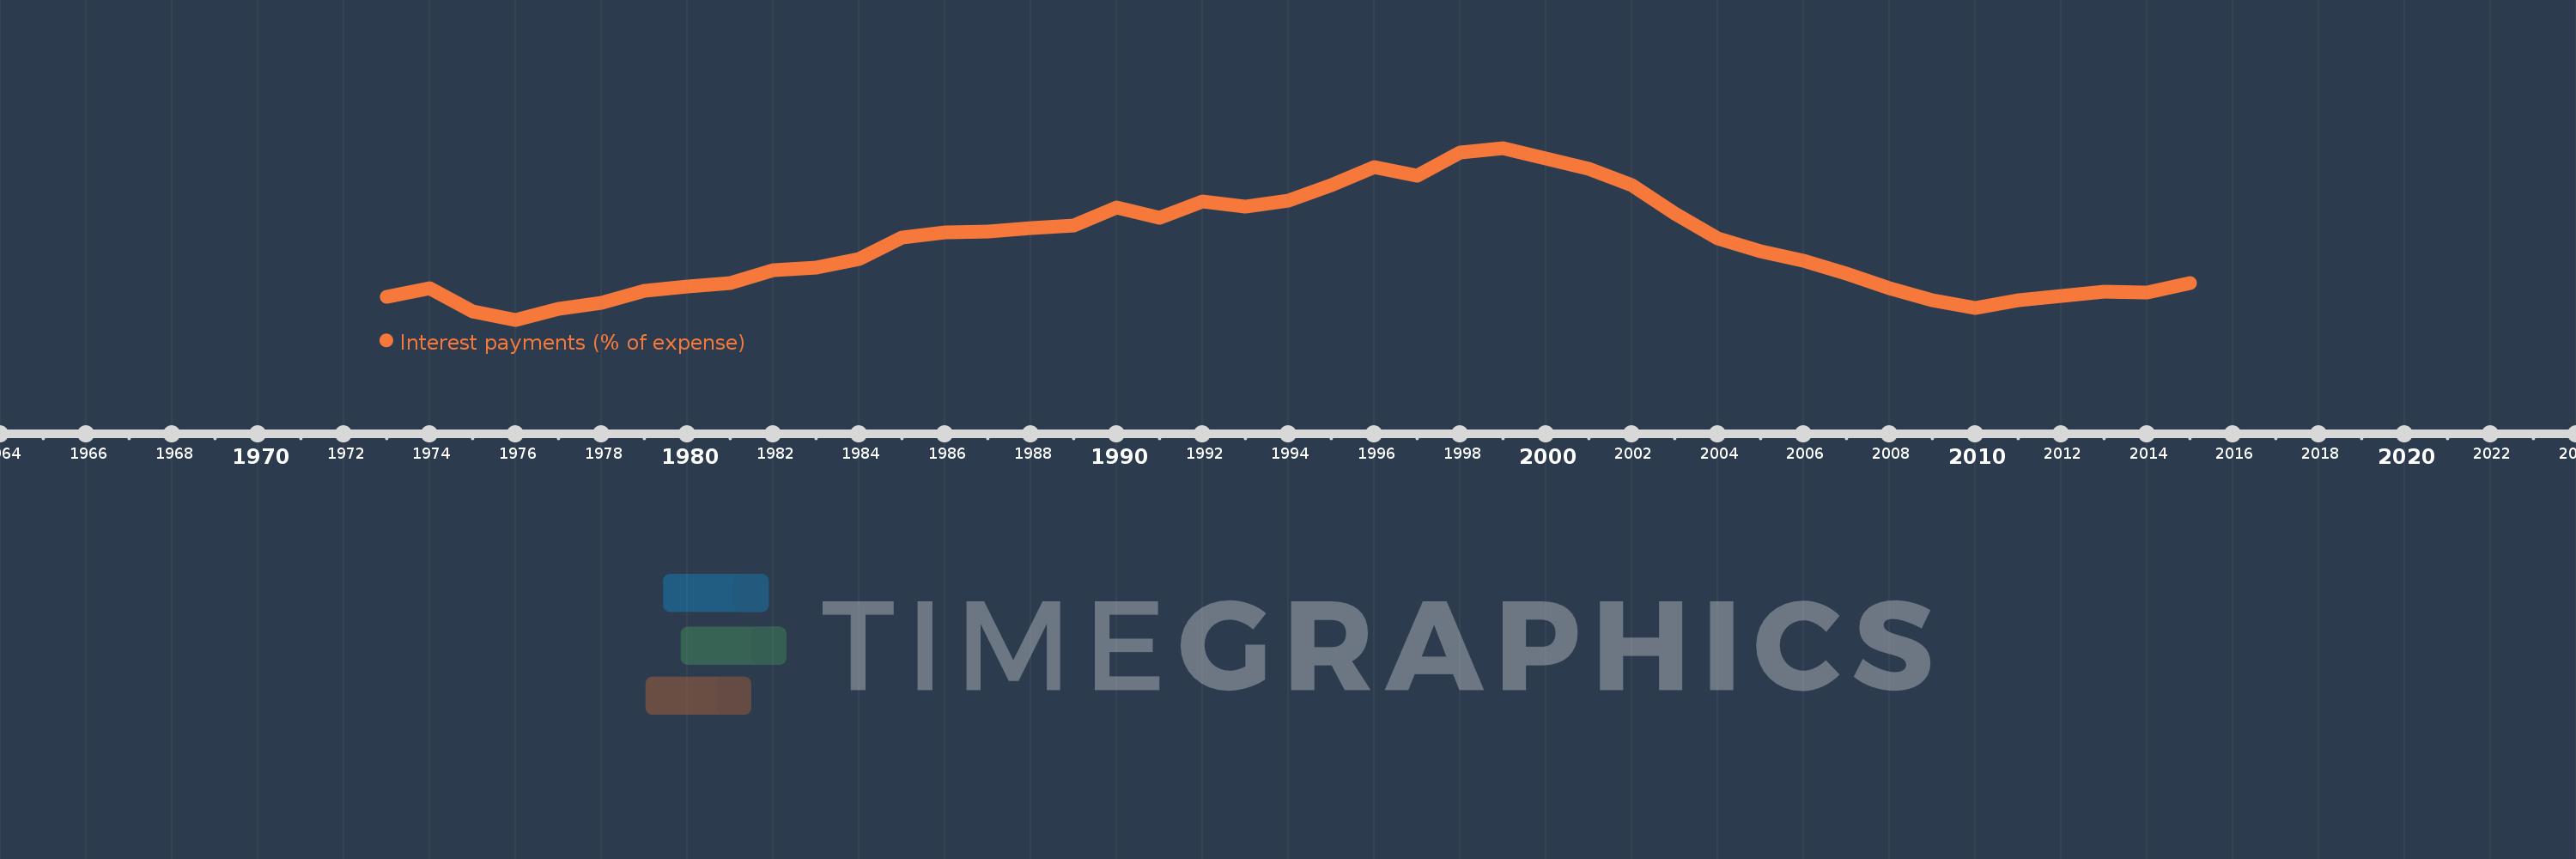
Interest payments (% of expense)
2015,2014,2013,2012,2011,2010,2009,2008,2007,2006,2005,2004,2003,2002,2001,2000,1999,1998,1997,1996,1995,1994,1993,1992,1991,1990,1989,1988,1987,1986,1985,1984,1983,1982,1981,1980,1979,1978,1977,1976,1975,1974,1973
This statistics in other country:
AfghanistanAlbaniaAlgeriaAngolaAntigua and BarbudaArab WorldArmeniaAustraliaAustriaAzerbaijanBahamas, TheBahrainBangladeshBarbadosBelarusBelgiumBelizeBeninBhutanBoliviaBosnia and HerzegovinaBotswanaBrazilBulgariaBurkina FasoBurundiCabo VerdeCambodiaCanadaCaribbean small statesCentral African RepublicCentral Europe and the BalticsChileColombiaCongo, Dem. Rep.Congo, Rep.Costa RicaCote d'IvoireCroatiaCyprusCzech RepublicDenmarkDominicaDominican RepublicEarly-demographic dividendEast Asia & PacificEast Asia & Pacific (excluding high income)East Asia & Pacific (IDA & IBRD countries)Egypt, Arab Rep.El SalvadorEquatorial GuineaEstoniaEthiopiaEuro areaEurope & Central AsiaEurope & Central Asia (excluding high income)Europe & Central Asia (IDA & IBRD countries)European UnionFijiFinlandFranceGambia, TheGeorgiaGermanyGhanaGreeceGrenadaGuatemalaHeavily indebted poor countries (HIPC)High incomeHondurasHong Kong SAR, ChinaHungaryIBRD onlyIcelandIDA & IBRD totalIDA blendIDA onlyIDA totalIndiaIndonesiaIran, Islamic Rep.IraqIrelandIsraelItalyJamaicaJapanJordanKazakhstanKenyaKiribatiKorea, Rep.KuwaitKyrgyz RepublicLao PDRLate-demographic dividendLatin America & Caribbean Latin America & Caribbean (excluding high income)Latin America & the Caribbean (IDA & IBRD countries)LatviaLeast developed countries: UN classificationLebanonLesothoLiberiaLithuaniaLow & middle incomeLow incomeLower middle incomeLuxembourgMacao SAR, ChinaMacedonia, FYRMadagascarMalawiMalaysiaMaldivesMaliMaltaMauritiusMexicoMicronesia, Fed. Sts.Middle East & North AfricaMiddle East & North Africa (excluding high income)Middle East & North Africa (IDA & IBRD countries)Middle incomeMoldovaMongoliaMoroccoMozambiqueNamibiaNepalNetherlandsNew ZealandNicaraguaNigeriaNorth AmericaNorwayOECD membersOmanOther small statesPakistanPanamaPapua New GuineaParaguayPeruPhilippinesPolandPortugalPost-demographic dividendPre-demographic dividendQatarRomaniaRussian FederationRwandaSamoaSan MarinoSao Tome and PrincipeSenegalSerbiaSeychellesSierra LeoneSingaporeSlovak RepublicSloveniaSmall statesSolomon IslandsSouth AfricaSouth AsiaSouth Asia (IDA & IBRD)SpainSri LankaSt. Kitts and NevisSt. LuciaSub-Saharan Africa Sub-Saharan Africa (excluding high income)Sub-Saharan Africa (IDA & IBRD countries)SurinameSwazilandSwedenSwitzerlandSyrian Arab RepublicTajikistanTanzaniaThailandTimor-LesteTogoTrinidad and TobagoTunisiaTurkeyUgandaUkraineUnited KingdomUnited StatesUpper middle incomeUruguayVanuatuVenezuela, RBVietnamWest Bank and GazaWorldYemen, Rep.ZambiaZimbabwe Timeline:
This timeline shows a graph from 1973 to 2015 of South Africa. No data until 1972. Number of actual observations by date: 43.
Source name:
World Development Indicators
Source organization:
International Monetary Fund, Government Finance Statistics Yearbook and data files.
Categories, topics:
Public Sector
Last updated:
apr 23, 2017
Indicators value changes by year
Maximum:
19.748
jan 1, 1999
At the date of observation
Value
Absolute change
Change from previous value
jan 1, 1973
7.962
+7.962
0.0%
jan 1, 1974
8.644
+0.683
8.58%
jan 1, 1975
6.848
-1.796
-20.78%
jan 1, 1976
6.172
-0.677
-9.88%
jan 1, 1977
7.029
+0.857
13.88%
jan 1, 1978
7.482
+0.454
6.45%
jan 1, 1979
8.431
+0.949
12.68%
jan 1, 1980
8.771
+0.34
4.03%
jan 1, 1981
9.064
+0.293
3.34%
jan 1, 1982
10.059
+0.996
10.99%
jan 1, 1983
10.316
+0.256
2.55%
jan 1, 1984
10.943
+0.628
6.08%
jan 1, 1985
12.675
+1.732
15.82%
jan 1, 1986
13.071
+0.396
3.12%
jan 1, 1987
13.111
+0.04
0.31%
jan 1, 1988
13.401
+0.29
2.21%
jan 1, 1989
13.588
+0.187
1.39%
jan 1, 1990
15.072
+1.484
10.92%
jan 1, 1991
14.257
-0.815
-5.4%
jan 1, 1992
15.488
+1.23
8.63%
jan 1, 1993
15.119
-0.368
-2.38%
jan 1, 1994
15.565
+0.446
2.95%
jan 1, 1995
16.777
+1.212
7.79%
jan 1, 1996
18.251
+1.474
8.79%
jan 1, 1997
17.587
-0.664
-3.64%
jan 1, 1998
19.422
+1.835
10.43%
jan 1, 1999
19.748
+0.326
1.68%
jan 1, 2000
18.912
-0.836
-4.23%
jan 1, 2001
18.106
-0.806
-4.26%
jan 1, 2002
16.802
-1.304
-7.2%
jan 1, 2003
14.558
-2.243
-13.35%
jan 1, 2004
12.569
-1.989
-13.66%
jan 1, 2005
11.561
-1.008
-8.02%
jan 1, 2006
10.859
-0.702
-6.07%
jan 1, 2007
9.85
-1.009
-9.29%
jan 1, 2008
8.673
-1.177
-11.95%
jan 1, 2009
7.698
-0.975
-11.25%
jan 1, 2010
7.116
-0.582
-7.56%
jan 1, 2011
7.688
+0.573
8.05%
jan 1, 2012
8.033
+0.344
4.48%
jan 1, 2013
8.409
+0.376
4.68%
jan 1, 2014
8.342
-0.067
-0.79%
jan 1, 2015
9.084
+0.741
8.89%
Ranking of countries by current statistics by years


Comments: