29
/
en
AIzaSyAYiBZKx7MnpbEhh9jyipgxe19OcubqV5w
April 1, 2024
162723
Jamaica
JAM
true
2
1
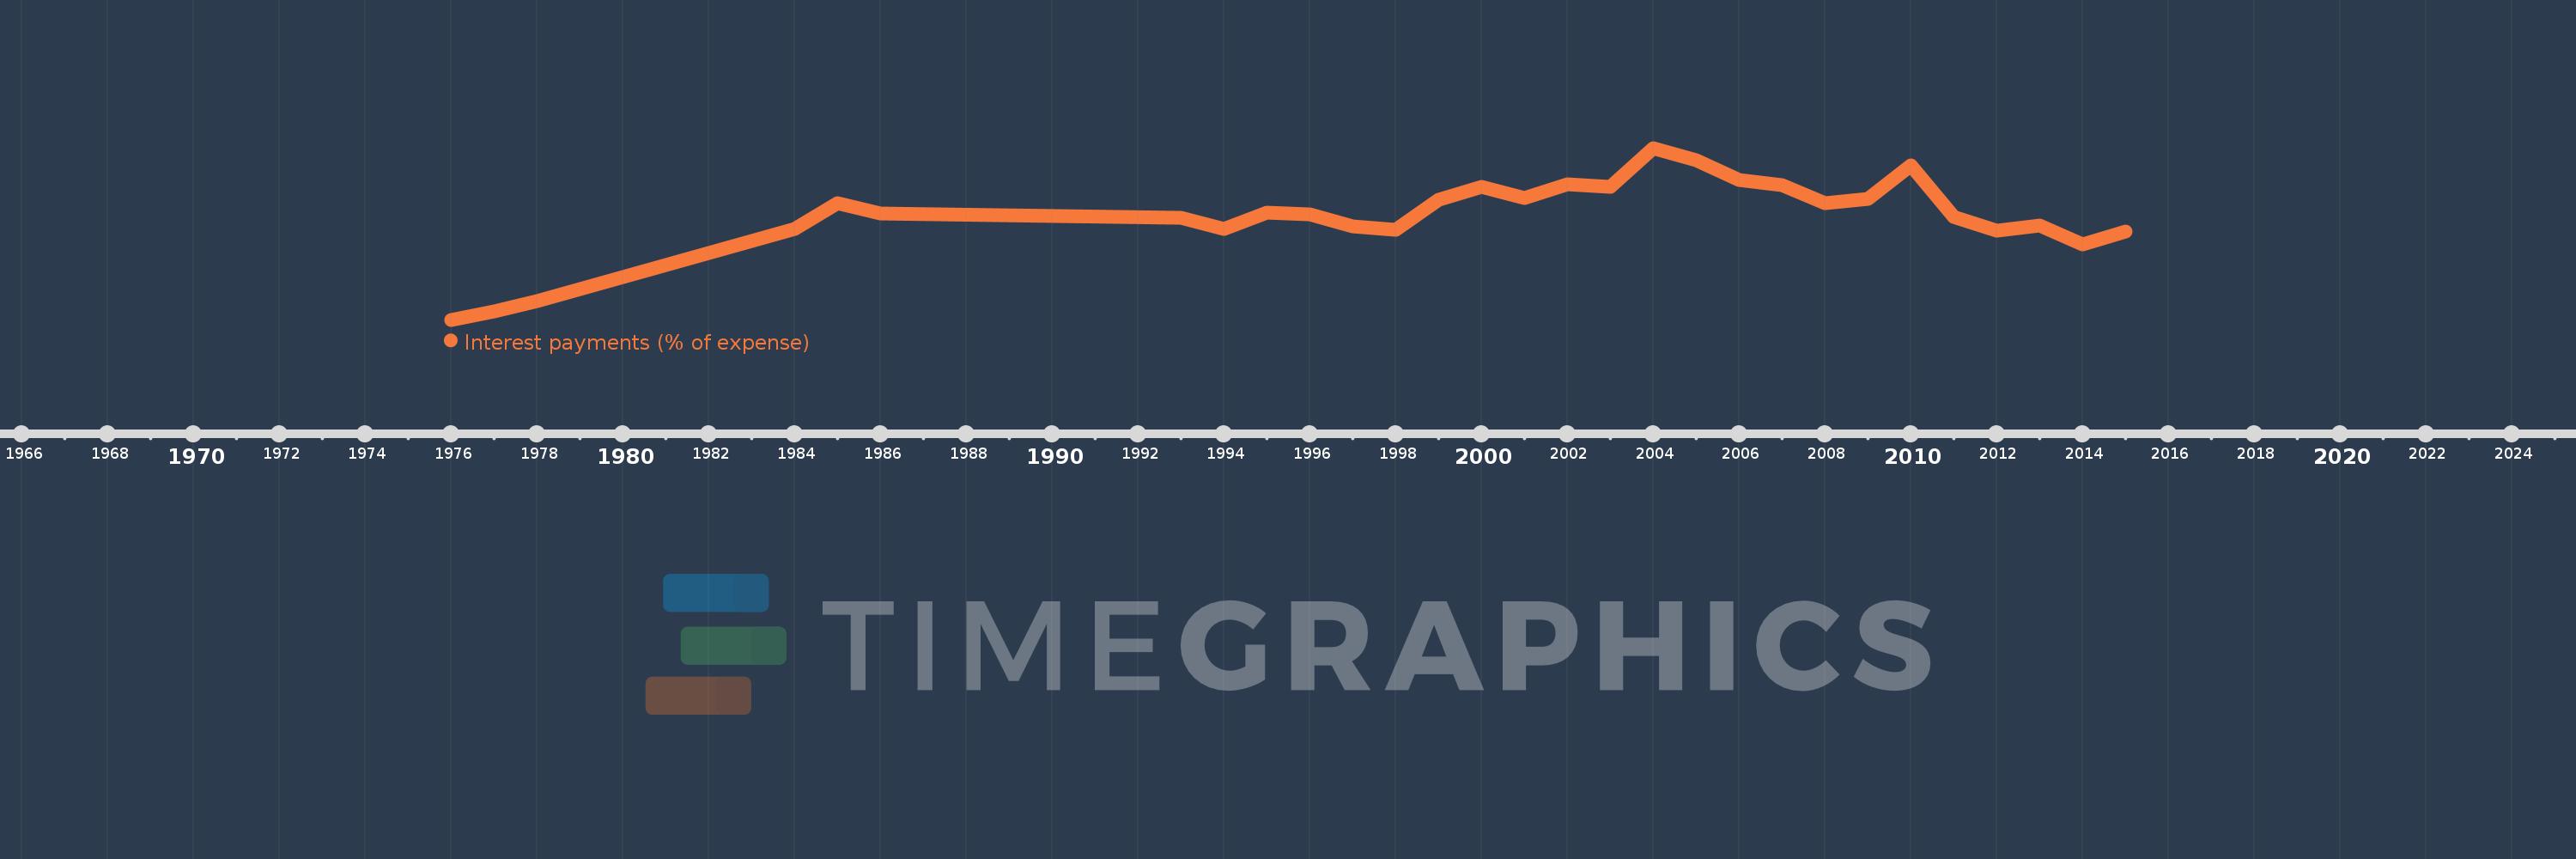
Interest payments (% of expense)
2015,2014,2013,2012,2011,2010,2009,2008,2007,2006,2005,2004,2003,2002,2001,2000,1999,1998,1997,1996,1995,1994,1993,1986,1985,1984,1978,1977,1976
This statistics in other country:
AfghanistanAlbaniaAlgeriaAngolaAntigua and BarbudaArab WorldArmeniaAustraliaAustriaAzerbaijanBahamas, TheBahrainBangladeshBarbadosBelarusBelgiumBelizeBeninBhutanBoliviaBosnia and HerzegovinaBotswanaBrazilBulgariaBurkina FasoBurundiCabo VerdeCambodiaCanadaCaribbean small statesCentral African RepublicCentral Europe and the BalticsChileColombiaCongo, Dem. Rep.Congo, Rep.Costa RicaCote d'IvoireCroatiaCyprusCzech RepublicDenmarkDominicaDominican RepublicEarly-demographic dividendEast Asia & PacificEast Asia & Pacific (excluding high income)East Asia & Pacific (IDA & IBRD countries)Egypt, Arab Rep.El SalvadorEquatorial GuineaEstoniaEthiopiaEuro areaEurope & Central AsiaEurope & Central Asia (excluding high income)Europe & Central Asia (IDA & IBRD countries)European UnionFijiFinlandFranceGambia, TheGeorgiaGermanyGhanaGreeceGrenadaGuatemalaHeavily indebted poor countries (HIPC)High incomeHondurasHong Kong SAR, ChinaHungaryIBRD onlyIcelandIDA & IBRD totalIDA blendIDA onlyIDA totalIndiaIndonesiaIran, Islamic Rep.IraqIrelandIsraelItalyJamaicaJapanJordanKazakhstanKenyaKiribatiKorea, Rep.KuwaitKyrgyz RepublicLao PDRLate-demographic dividendLatin America & Caribbean Latin America & Caribbean (excluding high income)Latin America & the Caribbean (IDA & IBRD countries)LatviaLeast developed countries: UN classificationLebanonLesothoLiberiaLithuaniaLow & middle incomeLow incomeLower middle incomeLuxembourgMacao SAR, ChinaMacedonia, FYRMadagascarMalawiMalaysiaMaldivesMaliMaltaMauritiusMexicoMicronesia, Fed. Sts.Middle East & North AfricaMiddle East & North Africa (excluding high income)Middle East & North Africa (IDA & IBRD countries)Middle incomeMoldovaMongoliaMoroccoMozambiqueNamibiaNepalNetherlandsNew ZealandNicaraguaNigeriaNorth AmericaNorwayOECD membersOmanOther small statesPakistanPanamaPapua New GuineaParaguayPeruPhilippinesPolandPortugalPost-demographic dividendPre-demographic dividendQatarRomaniaRussian FederationRwandaSamoaSan MarinoSao Tome and PrincipeSenegalSerbiaSeychellesSierra LeoneSingaporeSlovak RepublicSloveniaSmall statesSolomon IslandsSouth AfricaSouth AsiaSouth Asia (IDA & IBRD)SpainSri LankaSt. Kitts and NevisSt. LuciaSub-Saharan Africa Sub-Saharan Africa (excluding high income)Sub-Saharan Africa (IDA & IBRD countries)SurinameSwazilandSwedenSwitzerlandSyrian Arab RepublicTajikistanTanzaniaThailandTimor-LesteTogoTrinidad and TobagoTunisiaTurkeyUgandaUkraineUnited KingdomUnited StatesUpper middle incomeUruguayVanuatuVenezuela, RBVietnamWest Bank and GazaWorldYemen, Rep.ZambiaZimbabwe Timeline:
This timeline shows a graph from 1976 to 2015 of Jamaica. No data until 1975. Number of actual observations by date: 29.
Source name:
World Development Indicators
Source organization:
International Monetary Fund, Government Finance Statistics Yearbook and data files.
Categories, topics:
Public Sector
Last updated:
apr 23, 2017
Indicators value changes by year
Maximum:
47.147
jan 1, 2004
At the date of observation
Value
Absolute change
Change from previous value
jan 1, 1976
7.963
+7.963
0.0%
jan 1, 1977
9.904
+1.941
24.38%
jan 1, 1978
12.3
+2.396
24.19%
jan 1, 1984
28.665
+16.366
133.06%
jan 1, 1985
34.632
+5.967
20.81%
jan 1, 1986
32.214
-2.418
-6.98%
jan 1, 1993
31.262
-0.952
-2.96%
jan 1, 1994
28.575
-2.687
-8.6%
jan 1, 1995
32.471
+3.897
13.64%
jan 1, 1996
32.031
-0.44
-1.35%
jan 1, 1997
29.298
-2.733
-8.53%
jan 1, 1998
28.407
-0.892
-3.04%
jan 1, 1999
35.428
+7.021
24.72%
jan 1, 2000
38.28
+2.852
8.05%
jan 1, 2001
35.748
-2.532
-6.61%
jan 1, 2002
38.935
+3.186
8.91%
jan 1, 2003
38.361
-0.574
-1.47%
jan 1, 2004
47.147
+8.787
22.91%
jan 1, 2005
44.302
-2.846
-6.04%
jan 1, 2006
39.767
-4.535
-10.24%
jan 1, 2007
38.616
-1.151
-2.89%
jan 1, 2008
34.623
-3.993
-10.34%
jan 1, 2009
35.525
+0.902
2.61%
jan 1, 2010
43.238
+7.713
21.71%
jan 1, 2011
31.384
-11.854
-27.41%
jan 1, 2012
28.224
-3.16
-10.07%
jan 1, 2013
29.459
+1.235
4.37%
jan 1, 2014
25.243
-4.216
-14.31%
jan 1, 2015
28.086
+2.843
11.26%
Ranking of countries by current statistics by years


Comments: