29
/
en
AIzaSyAYiBZKx7MnpbEhh9jyipgxe19OcubqV5w
April 1, 2024
139419
Germany
DEU
true
2
1
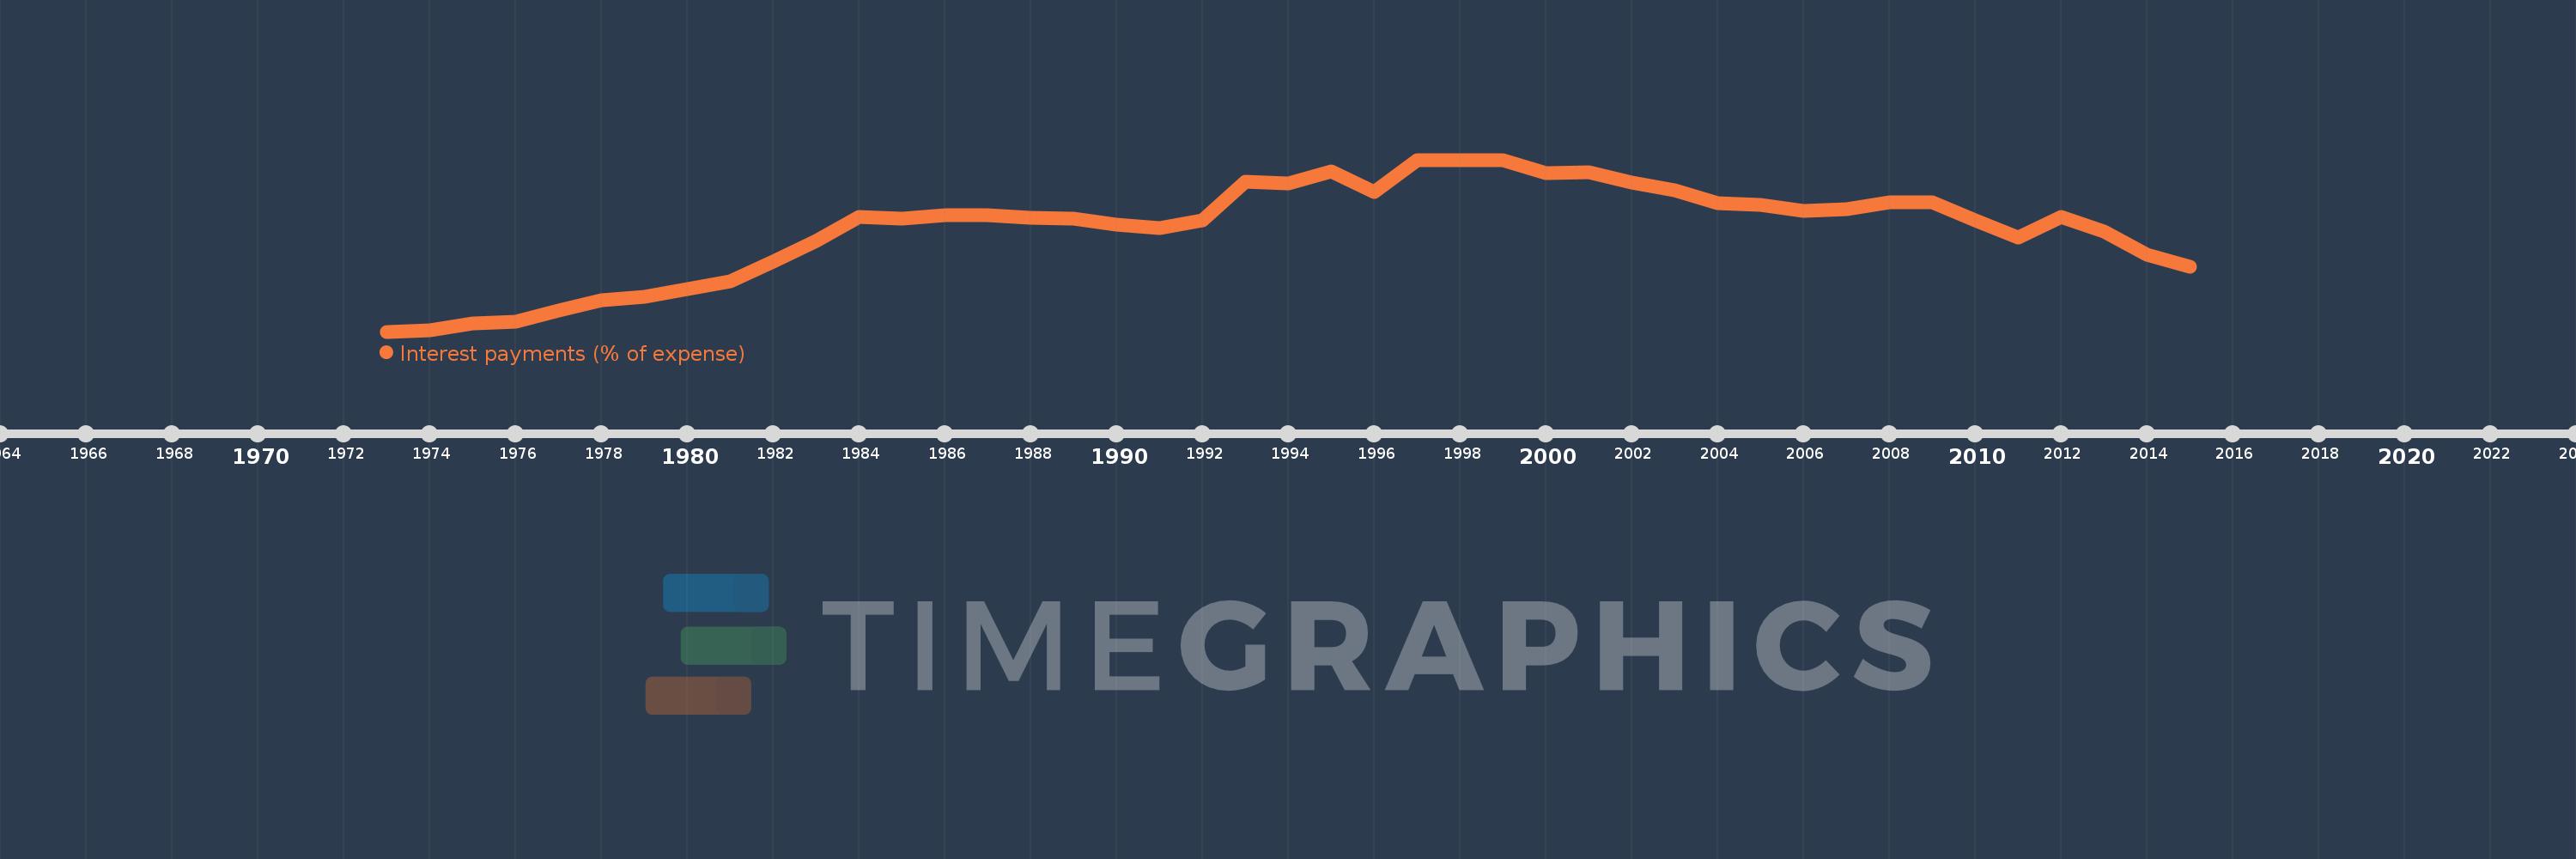
Interest payments (% of expense)
2015,2014,2013,2012,2011,2010,2009,2008,2007,2006,2005,2004,2003,2002,2001,2000,1999,1998,1997,1996,1995,1994,1993,1992,1991,1990,1989,1988,1987,1986,1985,1984,1983,1982,1981,1980,1979,1978,1977,1976,1975,1974,1973
This statistics in other country:
AfghanistanAlbaniaAlgeriaAngolaAntigua and BarbudaArab WorldArmeniaAustraliaAustriaAzerbaijanBahamas, TheBahrainBangladeshBarbadosBelarusBelgiumBelizeBeninBhutanBoliviaBosnia and HerzegovinaBotswanaBrazilBulgariaBurkina FasoBurundiCabo VerdeCambodiaCanadaCaribbean small statesCentral African RepublicCentral Europe and the BalticsChileColombiaCongo, Dem. Rep.Congo, Rep.Costa RicaCote d'IvoireCroatiaCyprusCzech RepublicDenmarkDominicaDominican RepublicEarly-demographic dividendEast Asia & PacificEast Asia & Pacific (excluding high income)East Asia & Pacific (IDA & IBRD countries)Egypt, Arab Rep.El SalvadorEquatorial GuineaEstoniaEthiopiaEuro areaEurope & Central AsiaEurope & Central Asia (excluding high income)Europe & Central Asia (IDA & IBRD countries)European UnionFijiFinlandFranceGambia, TheGeorgiaGermanyGhanaGreeceGrenadaGuatemalaHeavily indebted poor countries (HIPC)High incomeHondurasHong Kong SAR, ChinaHungaryIBRD onlyIcelandIDA & IBRD totalIDA blendIDA onlyIDA totalIndiaIndonesiaIran, Islamic Rep.IraqIrelandIsraelItalyJamaicaJapanJordanKazakhstanKenyaKiribatiKorea, Rep.KuwaitKyrgyz RepublicLao PDRLate-demographic dividendLatin America & Caribbean Latin America & Caribbean (excluding high income)Latin America & the Caribbean (IDA & IBRD countries)LatviaLeast developed countries: UN classificationLebanonLesothoLiberiaLithuaniaLow & middle incomeLow incomeLower middle incomeLuxembourgMacao SAR, ChinaMacedonia, FYRMadagascarMalawiMalaysiaMaldivesMaliMaltaMauritiusMexicoMicronesia, Fed. Sts.Middle East & North AfricaMiddle East & North Africa (excluding high income)Middle East & North Africa (IDA & IBRD countries)Middle incomeMoldovaMongoliaMoroccoMozambiqueNamibiaNepalNetherlandsNew ZealandNicaraguaNigeriaNorth AmericaNorwayOECD membersOmanOther small statesPakistanPanamaPapua New GuineaParaguayPeruPhilippinesPolandPortugalPost-demographic dividendPre-demographic dividendQatarRomaniaRussian FederationRwandaSamoaSan MarinoSao Tome and PrincipeSenegalSerbiaSeychellesSierra LeoneSingaporeSlovak RepublicSloveniaSmall statesSolomon IslandsSouth AfricaSouth AsiaSouth Asia (IDA & IBRD)SpainSri LankaSt. Kitts and NevisSt. LuciaSub-Saharan Africa Sub-Saharan Africa (excluding high income)Sub-Saharan Africa (IDA & IBRD countries)SurinameSwazilandSwedenSwitzerlandSyrian Arab RepublicTajikistanTanzaniaThailandTimor-LesteTogoTrinidad and TobagoTunisiaTurkeyUgandaUkraineUnited KingdomUnited StatesUpper middle incomeUruguayVanuatuVenezuela, RBVietnamWest Bank and GazaWorldYemen, Rep.ZambiaZimbabwe Timeline:
This timeline shows a graph from 1973 to 2015 of Germany. No data until 1972. Number of actual observations by date: 43.
Source name:
World Development Indicators
Source organization:
International Monetary Fund, Government Finance Statistics Yearbook and data files.
Categories, topics:
Public Sector
Last updated:
apr 23, 2017
Indicators value changes by year
At the date of observation
Value
Absolute change
Change from previous value
jan 1, 1973
1.582
+1.582
0.0%
jan 1, 1974
1.615
+0.033
2.1%
jan 1, 1975
1.834
+0.219
13.54%
jan 1, 1976
1.912
+0.078
4.26%
jan 1, 1977
2.27
+0.358
18.72%
jan 1, 1978
2.608
+0.338
14.91%
jan 1, 1979
2.71
+0.102
3.92%
jan 1, 1980
2.956
+0.245
9.06%
jan 1, 1981
3.22
+0.264
8.94%
jan 1, 1982
3.848
+0.628
19.51%
jan 1, 1983
4.527
+0.678
17.62%
jan 1, 1984
5.294
+0.768
16.96%
jan 1, 1985
5.229
-0.065
-1.23%
jan 1, 1986
5.347
+0.118
2.25%
jan 1, 1987
5.347
0.0
0.0%
jan 1, 1988
5.253
-0.094
-1.76%
jan 1, 1989
5.223
-0.03
-0.58%
jan 1, 1990
5.053
-0.169
-3.24%
jan 1, 1991
4.933
-0.12
-2.37%
jan 1, 1992
5.168
+0.235
4.77%
jan 1, 1993
6.44
+1.272
24.61%
jan 1, 1994
6.365
-0.075
-1.17%
jan 1, 1995
6.776
+0.411
6.45%
jan 1, 1996
6.096
-0.68
-10.04%
jan 1, 1997
7.131
+1.036
16.99%
jan 1, 1998
7.125
-0.006
-0.09%
jan 1, 1999
7.139
+0.014
0.2%
jan 1, 2000
6.718
-0.421
-5.9%
jan 1, 2001
6.743
+0.025
0.38%
jan 1, 2002
6.416
-0.327
-4.85%
jan 1, 2003
6.163
-0.253
-3.95%
jan 1, 2004
5.737
-0.425
-6.9%
jan 1, 2005
5.671
-0.067
-1.16%
jan 1, 2006
5.498
-0.172
-3.04%
jan 1, 2007
5.552
+0.054
0.98%
jan 1, 2008
5.765
+0.213
3.84%
jan 1, 2009
5.75
-0.015
-0.27%
jan 1, 2010
5.173
-0.577
-10.03%
jan 1, 2011
4.626
-0.548
-10.58%
jan 1, 2012
5.283
+0.657
14.2%
jan 1, 2013
4.814
-0.469
-8.87%
jan 1, 2014
4.068
-0.746
-15.5%
jan 1, 2015
3.69
-0.378
-9.29%
Ranking of countries by current statistics by years


Comments: