29
/
en
AIzaSyAYiBZKx7MnpbEhh9jyipgxe19OcubqV5w
April 1, 2024
163909
Japan
JPN
true
2
1
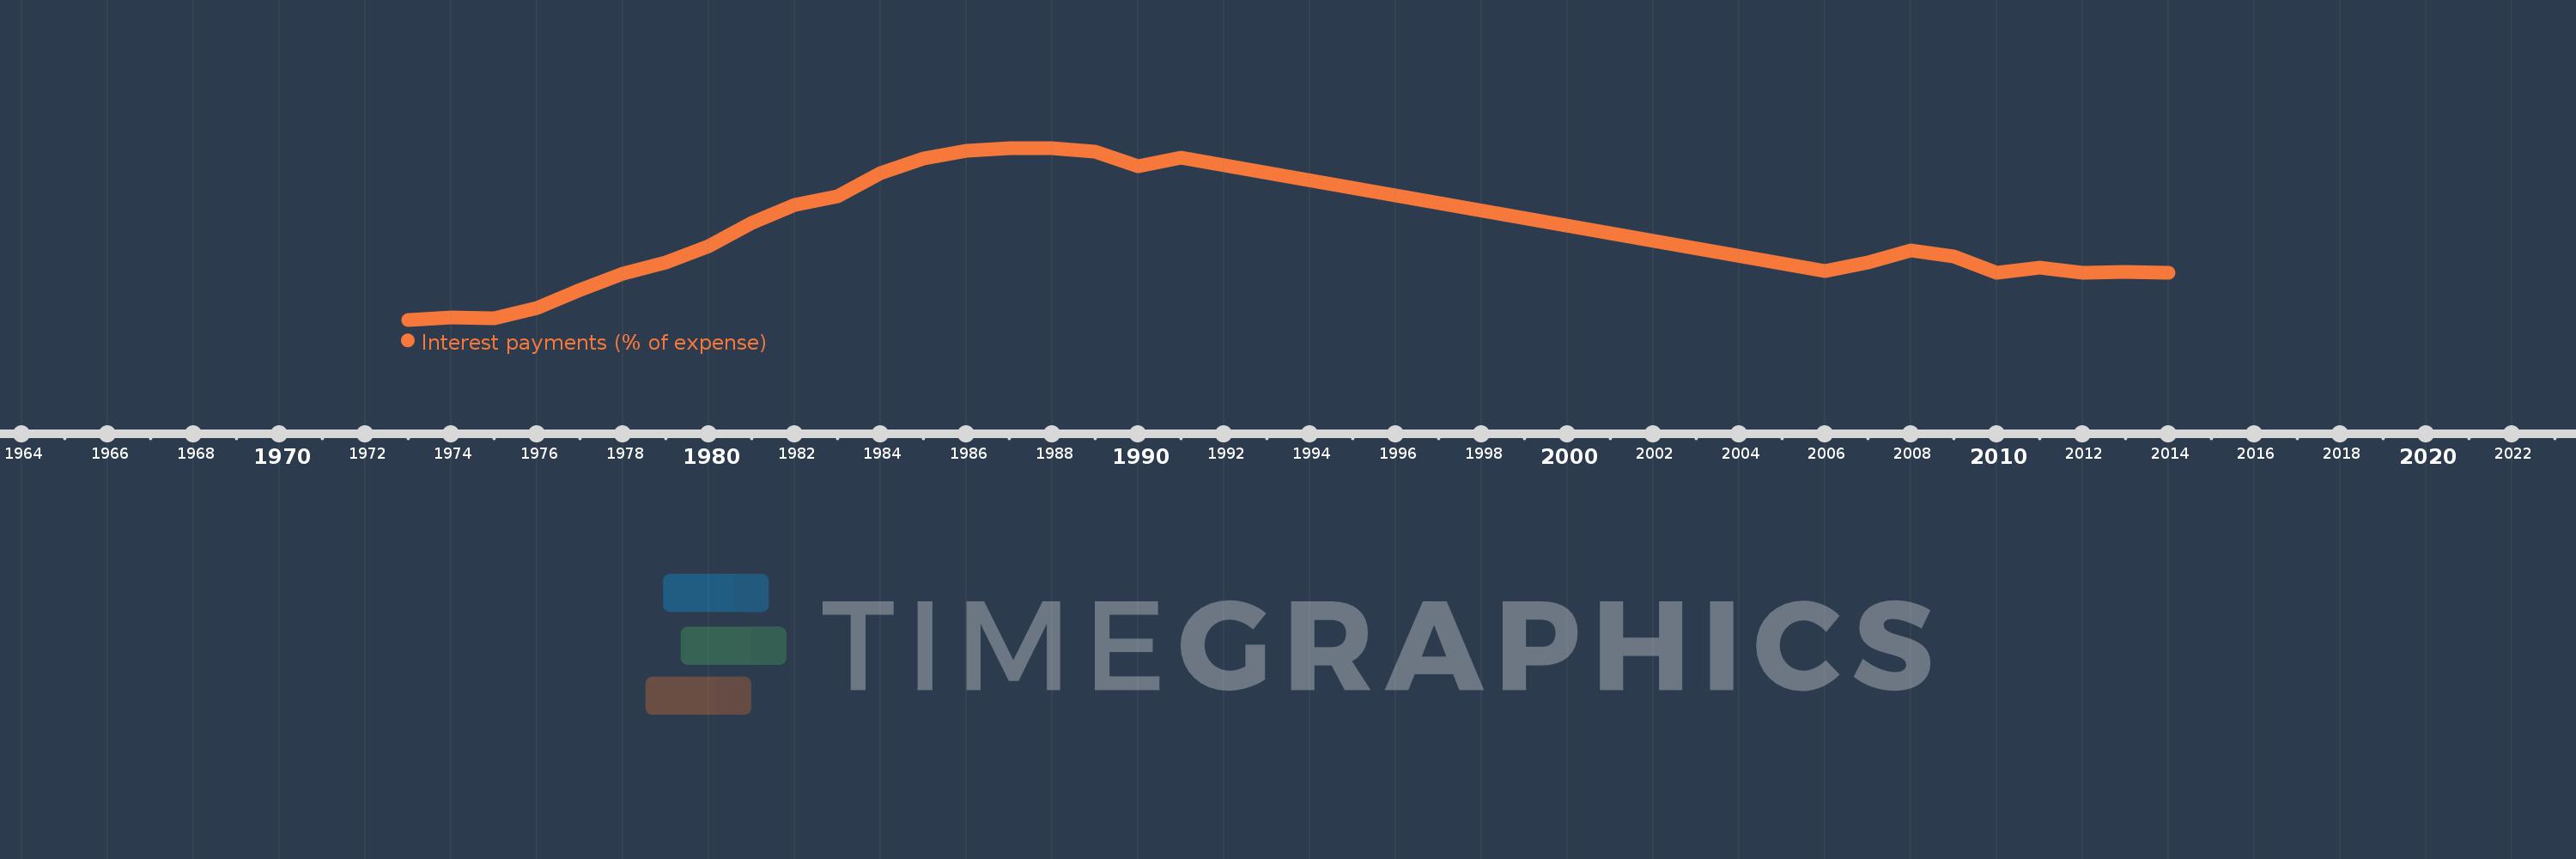
Interest payments (% of expense)
2014,2013,2012,2011,2010,2009,2008,2007,2006,1991,1990,1989,1988,1987,1986,1985,1984,1983,1982,1981,1980,1979,1978,1977,1976,1975,1974,1973
This statistics in other country:
AfghanistanAlbaniaAlgeriaAngolaAntigua and BarbudaArab WorldArmeniaAustraliaAustriaAzerbaijanBahamas, TheBahrainBangladeshBarbadosBelarusBelgiumBelizeBeninBhutanBoliviaBosnia and HerzegovinaBotswanaBrazilBulgariaBurkina FasoBurundiCabo VerdeCambodiaCanadaCaribbean small statesCentral African RepublicCentral Europe and the BalticsChileColombiaCongo, Dem. Rep.Congo, Rep.Costa RicaCote d'IvoireCroatiaCyprusCzech RepublicDenmarkDominicaDominican RepublicEarly-demographic dividendEast Asia & PacificEast Asia & Pacific (excluding high income)East Asia & Pacific (IDA & IBRD countries)Egypt, Arab Rep.El SalvadorEquatorial GuineaEstoniaEthiopiaEuro areaEurope & Central AsiaEurope & Central Asia (excluding high income)Europe & Central Asia (IDA & IBRD countries)European UnionFijiFinlandFranceGambia, TheGeorgiaGermanyGhanaGreeceGrenadaGuatemalaHeavily indebted poor countries (HIPC)High incomeHondurasHong Kong SAR, ChinaHungaryIBRD onlyIcelandIDA & IBRD totalIDA blendIDA onlyIDA totalIndiaIndonesiaIran, Islamic Rep.IraqIrelandIsraelItalyJamaicaJapanJordanKazakhstanKenyaKiribatiKorea, Rep.KuwaitKyrgyz RepublicLao PDRLate-demographic dividendLatin America & Caribbean Latin America & Caribbean (excluding high income)Latin America & the Caribbean (IDA & IBRD countries)LatviaLeast developed countries: UN classificationLebanonLesothoLiberiaLithuaniaLow & middle incomeLow incomeLower middle incomeLuxembourgMacao SAR, ChinaMacedonia, FYRMadagascarMalawiMalaysiaMaldivesMaliMaltaMauritiusMexicoMicronesia, Fed. Sts.Middle East & North AfricaMiddle East & North Africa (excluding high income)Middle East & North Africa (IDA & IBRD countries)Middle incomeMoldovaMongoliaMoroccoMozambiqueNamibiaNepalNetherlandsNew ZealandNicaraguaNigeriaNorth AmericaNorwayOECD membersOmanOther small statesPakistanPanamaPapua New GuineaParaguayPeruPhilippinesPolandPortugalPost-demographic dividendPre-demographic dividendQatarRomaniaRussian FederationRwandaSamoaSan MarinoSao Tome and PrincipeSenegalSerbiaSeychellesSierra LeoneSingaporeSlovak RepublicSloveniaSmall statesSolomon IslandsSouth AfricaSouth AsiaSouth Asia (IDA & IBRD)SpainSri LankaSt. Kitts and NevisSt. LuciaSub-Saharan Africa Sub-Saharan Africa (excluding high income)Sub-Saharan Africa (IDA & IBRD countries)SurinameSwazilandSwedenSwitzerlandSyrian Arab RepublicTajikistanTanzaniaThailandTimor-LesteTogoTrinidad and TobagoTunisiaTurkeyUgandaUkraineUnited KingdomUnited StatesUpper middle incomeUruguayVanuatuVenezuela, RBVietnamWest Bank and GazaWorldYemen, Rep.ZambiaZimbabwe Timeline:
This timeline shows a graph from 1973 to 2014 of Japan. No data until 1972. Number of actual observations by date: 28.
Source name:
World Development Indicators
Source organization:
International Monetary Fund, Government Finance Statistics Yearbook and data files.
Categories, topics:
Public Sector
Last updated:
apr 23, 2017
Indicators value changes by year
Maximum:
21.449
jan 1, 1987
At the date of observation
Value
Absolute change
Change from previous value
jan 1, 1973
4.626
+4.626
0.0%
jan 1, 1974
4.856
+0.231
4.99%
jan 1, 1975
4.727
-0.129
-2.67%
jan 1, 1976
5.765
+1.038
21.97%
jan 1, 1977
7.528
+1.763
30.57%
jan 1, 1978
9.117
+1.589
21.11%
jan 1, 1979
10.233
+1.116
12.24%
jan 1, 1980
11.829
+1.596
15.59%
jan 1, 1981
14.122
+2.293
19.39%
jan 1, 1982
15.845
+1.723
12.2%
jan 1, 1983
16.74
+0.895
5.65%
jan 1, 1984
18.996
+2.256
13.48%
jan 1, 1985
20.422
+1.427
7.51%
jan 1, 1986
21.181
+0.759
3.72%
jan 1, 1987
21.449
+0.268
1.26%
jan 1, 1988
21.436
-0.013
-0.06%
jan 1, 1989
21.097
-0.338
-1.58%
jan 1, 1990
19.645
-1.452
-6.88%
jan 1, 1991
20.48
+0.835
4.25%
jan 1, 2006
9.377
-11.103
-54.21%
jan 1, 2007
10.266
+0.889
9.48%
jan 1, 2008
11.438
+1.172
11.42%
jan 1, 2009
10.804
-0.634
-5.54%
jan 1, 2010
9.268
-1.536
-14.22%
jan 1, 2011
9.698
+0.43
4.64%
jan 1, 2012
9.226
-0.472
-4.87%
jan 1, 2013
9.314
+0.088
0.95%
jan 1, 2014
9.25
-0.063
-0.68%
Ranking of countries by current statistics by years


Comments: