29
/
en
AIzaSyAYiBZKx7MnpbEhh9jyipgxe19OcubqV5w
April 1, 2024
209455
New Zealand
NZL
true
2
1
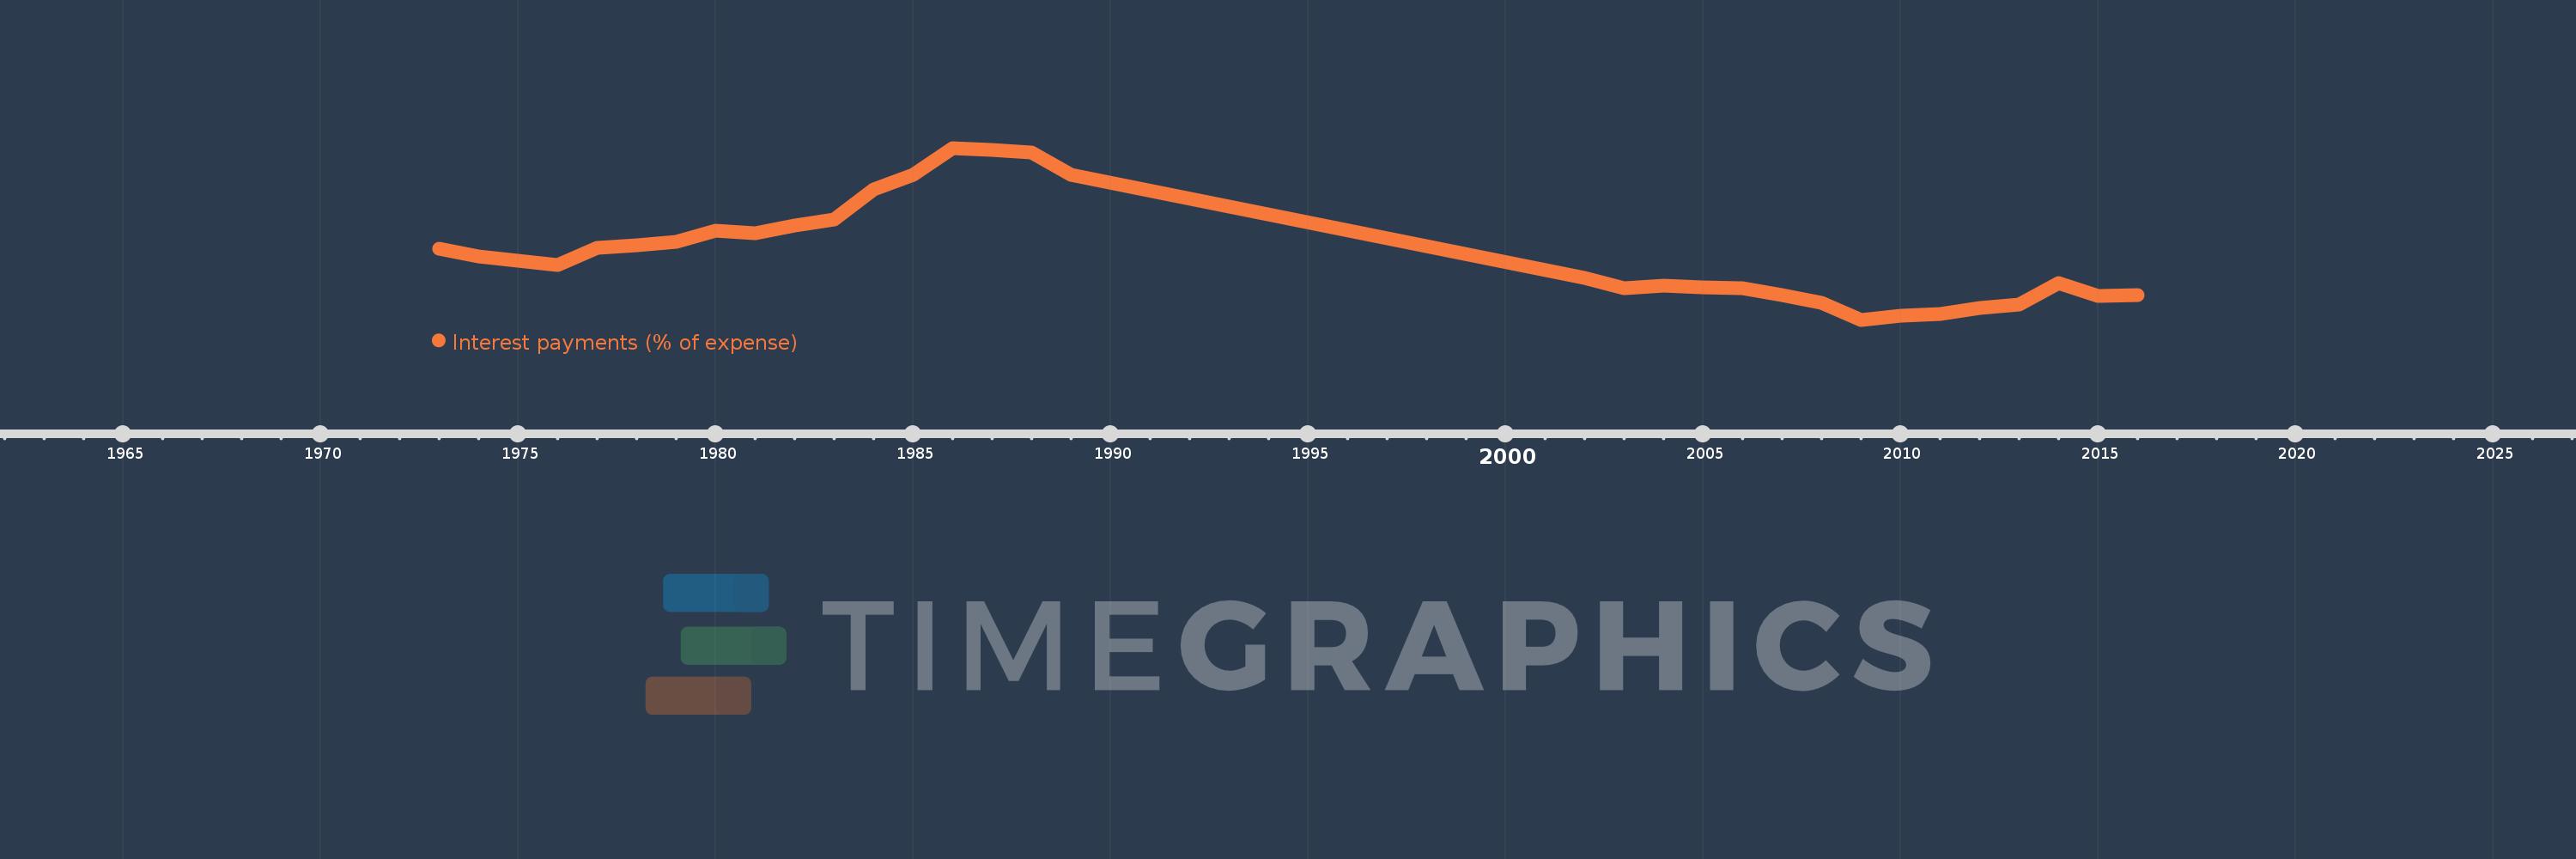
Interest payments (% of expense)
2016,2015,2014,2013,2012,2011,2010,2009,2008,2007,2006,2005,2004,2003,2002,1989,1988,1987,1986,1985,1984,1983,1982,1981,1980,1979,1978,1977,1976,1975,1974,1973
This statistics in other country:
AfghanistanAlbaniaAlgeriaAngolaAntigua and BarbudaArab WorldArmeniaAustraliaAustriaAzerbaijanBahamas, TheBahrainBangladeshBarbadosBelarusBelgiumBelizeBeninBhutanBoliviaBosnia and HerzegovinaBotswanaBrazilBulgariaBurkina FasoBurundiCabo VerdeCambodiaCanadaCaribbean small statesCentral African RepublicCentral Europe and the BalticsChileColombiaCongo, Dem. Rep.Congo, Rep.Costa RicaCote d'IvoireCroatiaCyprusCzech RepublicDenmarkDominicaDominican RepublicEarly-demographic dividendEast Asia & PacificEast Asia & Pacific (excluding high income)East Asia & Pacific (IDA & IBRD countries)Egypt, Arab Rep.El SalvadorEquatorial GuineaEstoniaEthiopiaEuro areaEurope & Central AsiaEurope & Central Asia (excluding high income)Europe & Central Asia (IDA & IBRD countries)European UnionFijiFinlandFranceGambia, TheGeorgiaGermanyGhanaGreeceGrenadaGuatemalaHeavily indebted poor countries (HIPC)High incomeHondurasHong Kong SAR, ChinaHungaryIBRD onlyIcelandIDA & IBRD totalIDA blendIDA onlyIDA totalIndiaIndonesiaIran, Islamic Rep.IraqIrelandIsraelItalyJamaicaJapanJordanKazakhstanKenyaKiribatiKorea, Rep.KuwaitKyrgyz RepublicLao PDRLate-demographic dividendLatin America & Caribbean Latin America & Caribbean (excluding high income)Latin America & the Caribbean (IDA & IBRD countries)LatviaLeast developed countries: UN classificationLebanonLesothoLiberiaLithuaniaLow & middle incomeLow incomeLower middle incomeLuxembourgMacao SAR, ChinaMacedonia, FYRMadagascarMalawiMalaysiaMaldivesMaliMaltaMauritiusMexicoMicronesia, Fed. Sts.Middle East & North AfricaMiddle East & North Africa (excluding high income)Middle East & North Africa (IDA & IBRD countries)Middle incomeMoldovaMongoliaMoroccoMozambiqueNamibiaNepalNetherlandsNew ZealandNicaraguaNigeriaNorth AmericaNorwayOECD membersOmanOther small statesPakistanPanamaPapua New GuineaParaguayPeruPhilippinesPolandPortugalPost-demographic dividendPre-demographic dividendQatarRomaniaRussian FederationRwandaSamoaSan MarinoSao Tome and PrincipeSenegalSerbiaSeychellesSierra LeoneSingaporeSlovak RepublicSloveniaSmall statesSolomon IslandsSouth AfricaSouth AsiaSouth Asia (IDA & IBRD)SpainSri LankaSt. Kitts and NevisSt. LuciaSub-Saharan Africa Sub-Saharan Africa (excluding high income)Sub-Saharan Africa (IDA & IBRD countries)SurinameSwazilandSwedenSwitzerlandSyrian Arab RepublicTajikistanTanzaniaThailandTimor-LesteTogoTrinidad and TobagoTunisiaTurkeyUgandaUkraineUnited KingdomUnited StatesUpper middle incomeUruguayVanuatuVenezuela, RBVietnamWest Bank and GazaWorldYemen, Rep.ZambiaZimbabwe Timeline:
This timeline shows a graph from 1973 to 2016 of New Zealand. No data until 1972. Number of actual observations by date: 32.
Source name:
World Development Indicators
Source organization:
International Monetary Fund, Government Finance Statistics Yearbook and data files.
Categories, topics:
Public Sector
Last updated:
apr 23, 2017
Indicators value changes by year
Maximum:
18.936
jan 1, 1986
At the date of observation
Value
Absolute change
Change from previous value
jan 1, 1973
9.069
+9.069
0.0%
jan 1, 1974
8.34
-0.728
-8.03%
jan 1, 1975
7.901
-0.439
-5.26%
jan 1, 1976
7.546
-0.355
-4.5%
jan 1, 1977
9.221
+1.675
22.2%
jan 1, 1978
9.45
+0.229
2.48%
jan 1, 1979
9.757
+0.307
3.25%
jan 1, 1980
10.822
+1.065
10.92%
jan 1, 1981
10.595
-0.227
-2.1%
jan 1, 1982
11.324
+0.729
6.88%
jan 1, 1983
11.938
+0.613
5.42%
jan 1, 1984
14.891
+2.953
24.73%
jan 1, 1985
16.29
+1.399
9.4%
jan 1, 1986
18.936
+2.646
16.24%
jan 1, 1987
18.743
-0.193
-1.02%
jan 1, 1988
18.464
-0.279
-1.49%
jan 1, 1989
16.326
-2.138
-11.58%
jan 1, 2002
6.265
-10.061
-61.63%
jan 1, 2003
5.278
-0.986
-15.75%
jan 1, 2004
5.528
+0.249
4.73%
jan 1, 2005
5.354
-0.174
-3.14%
jan 1, 2006
5.265
-0.089
-1.67%
jan 1, 2007
4.549
-0.715
-13.59%
jan 1, 2008
3.856
-0.693
-15.23%
jan 1, 2009
2.163
-1.694
-43.92%
jan 1, 2010
2.599
+0.436
20.18%
jan 1, 2011
2.703
+0.104
4.01%
jan 1, 2012
3.296
+0.593
21.93%
jan 1, 2013
3.624
+0.328
9.96%
jan 1, 2014
5.727
+2.103
58.02%
jan 1, 2015
4.51
-1.217
-21.25%
jan 1, 2016
4.538
+0.028
0.63%
Ranking of countries by current statistics by years


Comments: