29
/
en
AIzaSyAYiBZKx7MnpbEhh9jyipgxe19OcubqV5w
April 1, 2024
257456
Switzerland
CHE
true
2
1
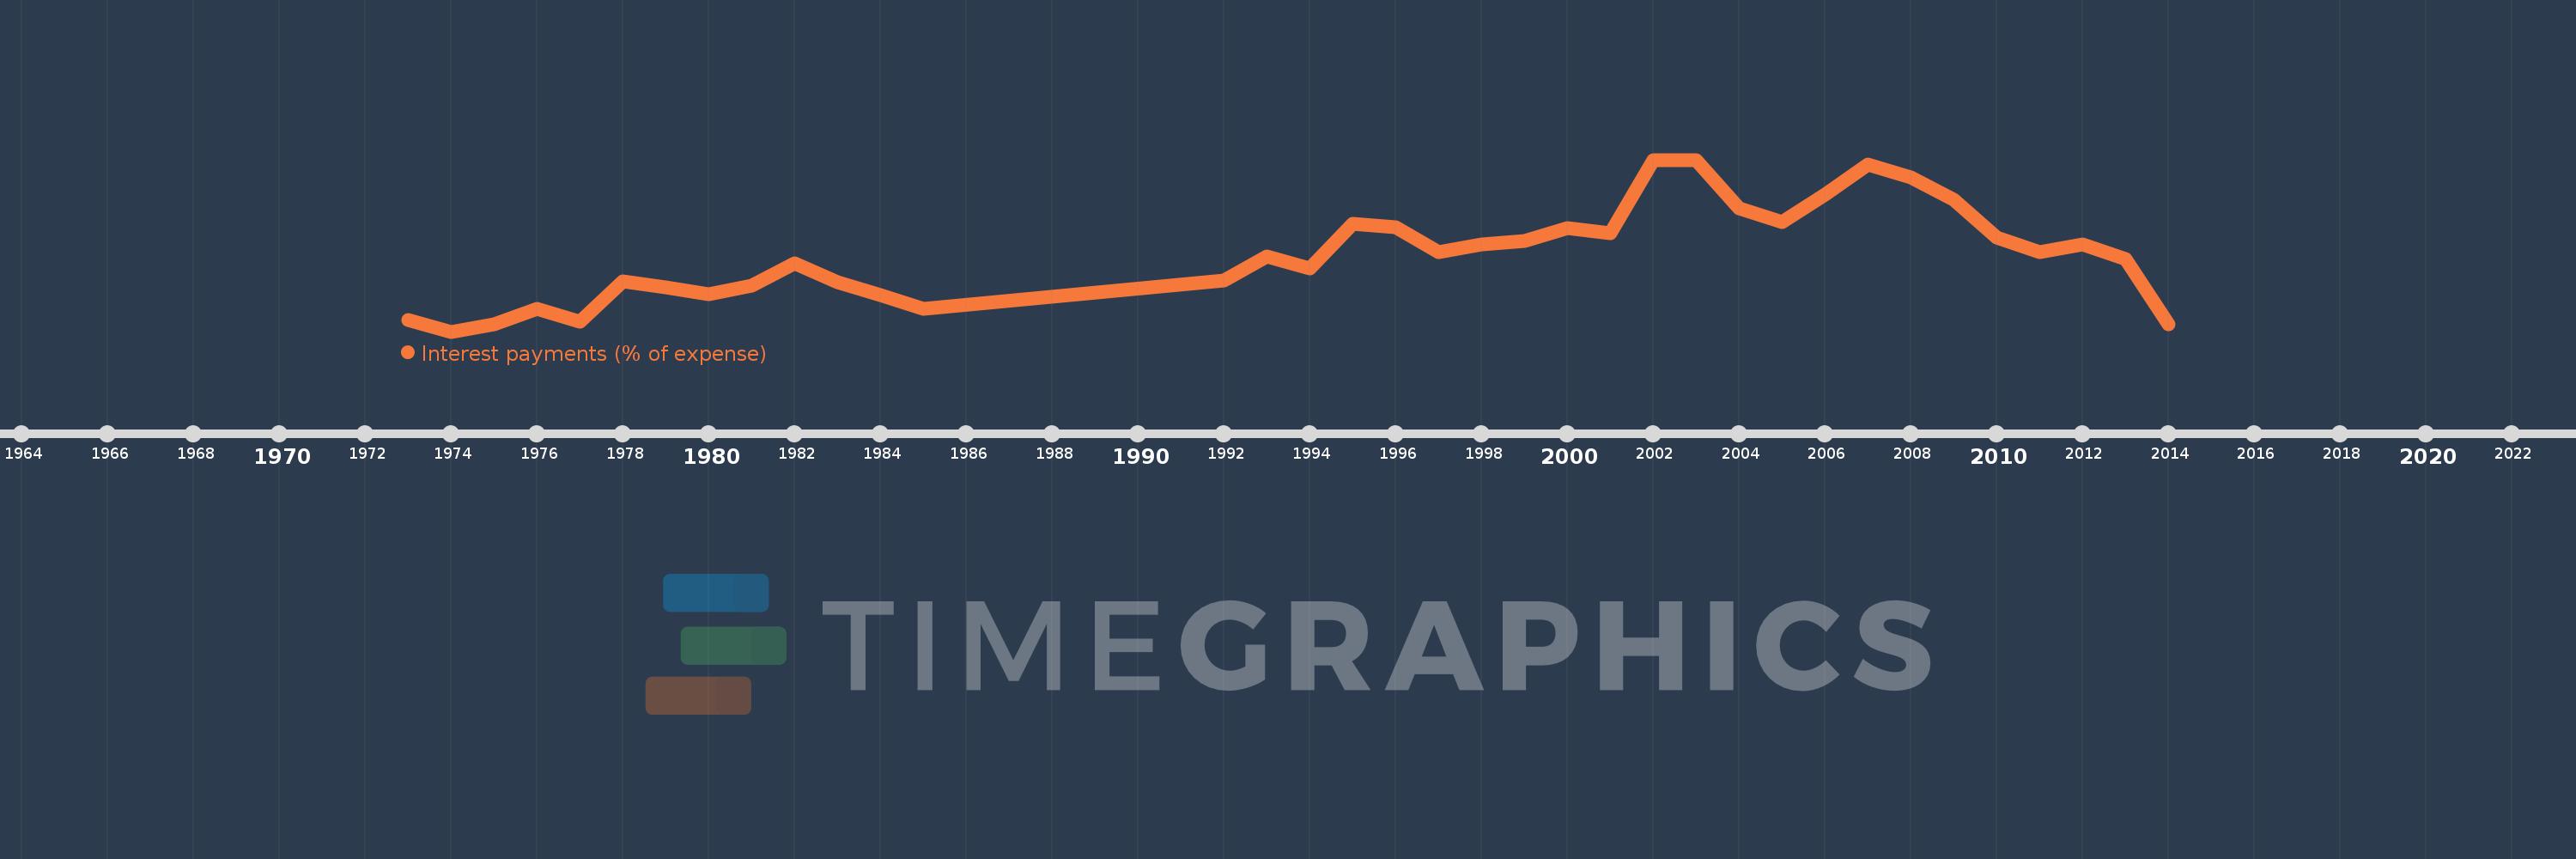
Interest payments (% of expense)
2014,2013,2012,2011,2010,2009,2008,2007,2006,2005,2004,2003,2002,2001,2000,1999,1998,1997,1996,1995,1994,1993,1992,1985,1984,1983,1982,1981,1980,1979,1978,1977,1976,1975,1974,1973
This statistics in other country:
AfghanistanAlbaniaAlgeriaAngolaAntigua and BarbudaArab WorldArmeniaAustraliaAustriaAzerbaijanBahamas, TheBahrainBangladeshBarbadosBelarusBelgiumBelizeBeninBhutanBoliviaBosnia and HerzegovinaBotswanaBrazilBulgariaBurkina FasoBurundiCabo VerdeCambodiaCanadaCaribbean small statesCentral African RepublicCentral Europe and the BalticsChileColombiaCongo, Dem. Rep.Congo, Rep.Costa RicaCote d'IvoireCroatiaCyprusCzech RepublicDenmarkDominicaDominican RepublicEarly-demographic dividendEast Asia & PacificEast Asia & Pacific (excluding high income)East Asia & Pacific (IDA & IBRD countries)Egypt, Arab Rep.El SalvadorEquatorial GuineaEstoniaEthiopiaEuro areaEurope & Central AsiaEurope & Central Asia (excluding high income)Europe & Central Asia (IDA & IBRD countries)European UnionFijiFinlandFranceGambia, TheGeorgiaGermanyGhanaGreeceGrenadaGuatemalaHeavily indebted poor countries (HIPC)High incomeHondurasHong Kong SAR, ChinaHungaryIBRD onlyIcelandIDA & IBRD totalIDA blendIDA onlyIDA totalIndiaIndonesiaIran, Islamic Rep.IraqIrelandIsraelItalyJamaicaJapanJordanKazakhstanKenyaKiribatiKorea, Rep.KuwaitKyrgyz RepublicLao PDRLate-demographic dividendLatin America & Caribbean Latin America & Caribbean (excluding high income)Latin America & the Caribbean (IDA & IBRD countries)LatviaLeast developed countries: UN classificationLebanonLesothoLiberiaLithuaniaLow & middle incomeLow incomeLower middle incomeLuxembourgMacao SAR, ChinaMacedonia, FYRMadagascarMalawiMalaysiaMaldivesMaliMaltaMauritiusMexicoMicronesia, Fed. Sts.Middle East & North AfricaMiddle East & North Africa (excluding high income)Middle East & North Africa (IDA & IBRD countries)Middle incomeMoldovaMongoliaMoroccoMozambiqueNamibiaNepalNetherlandsNew ZealandNicaraguaNigeriaNorth AmericaNorwayOECD membersOmanOther small statesPakistanPanamaPapua New GuineaParaguayPeruPhilippinesPolandPortugalPost-demographic dividendPre-demographic dividendQatarRomaniaRussian FederationRwandaSamoaSan MarinoSao Tome and PrincipeSenegalSerbiaSeychellesSierra LeoneSingaporeSlovak RepublicSloveniaSmall statesSolomon IslandsSouth AfricaSouth AsiaSouth Asia (IDA & IBRD)SpainSri LankaSt. Kitts and NevisSt. LuciaSub-Saharan Africa Sub-Saharan Africa (excluding high income)Sub-Saharan Africa (IDA & IBRD countries)SurinameSwazilandSwedenSwitzerlandSyrian Arab RepublicTajikistanTanzaniaThailandTimor-LesteTogoTrinidad and TobagoTunisiaTurkeyUgandaUkraineUnited KingdomUnited StatesUpper middle incomeUruguayVanuatuVenezuela, RBVietnamWest Bank and GazaWorldYemen, Rep.ZambiaZimbabwe Timeline:
This timeline shows a graph from 1973 to 2014 of Switzerland. No data until 1972. Number of actual observations by date: 36.
Source name:
World Development Indicators
Source organization:
International Monetary Fund, Government Finance Statistics Yearbook and data files.
Categories, topics:
Public Sector
Last updated:
apr 23, 2017
Indicators value changes by year
At the date of observation
Value
Absolute change
Change from previous value
jan 1, 1973
2.035
+2.035
0.0%
jan 1, 1974
1.853
-0.182
-8.95%
jan 1, 1975
1.963
+0.11
5.92%
jan 1, 1976
2.218
+0.255
13.01%
jan 1, 1977
2.012
-0.207
-9.31%
jan 1, 1978
2.643
+0.631
31.38%
jan 1, 1979
2.55
-0.094
-3.54%
jan 1, 1980
2.447
-0.103
-4.04%
jan 1, 1981
2.575
+0.129
5.25%
jan 1, 1982
2.929
+0.353
13.73%
jan 1, 1983
2.628
-0.301
-10.27%
jan 1, 1984
2.428
-0.199
-7.59%
jan 1, 1985
2.211
-0.217
-8.95%
jan 1, 1992
2.667
+0.455
20.6%
jan 1, 1993
3.037
+0.37
13.89%
jan 1, 1994
2.852
-0.185
-6.09%
jan 1, 1995
3.564
+0.712
24.98%
jan 1, 1996
3.508
-0.056
-1.58%
jan 1, 1997
3.107
-0.401
-11.42%
jan 1, 1998
3.229
+0.121
3.9%
jan 1, 1999
3.286
+0.058
1.79%
jan 1, 2000
3.494
+0.207
6.31%
jan 1, 2001
3.403
-0.091
-2.61%
jan 1, 2002
4.557
+1.154
33.92%
jan 1, 2003
4.569
+0.012
0.26%
jan 1, 2004
3.803
-0.766
-16.76%
jan 1, 2005
3.585
-0.218
-5.72%
jan 1, 2006
4.025
+0.44
12.28%
jan 1, 2007
4.501
+0.475
11.8%
jan 1, 2008
4.296
-0.205
-4.55%
jan 1, 2009
3.939
-0.357
-8.3%
jan 1, 2010
3.345
-0.594
-15.09%
jan 1, 2011
3.11
-0.234
-7.01%
jan 1, 2012
3.226
+0.115
3.7%
jan 1, 2013
3.0
-0.225
-6.99%
jan 1, 2014
1.968
-1.032
-34.4%
Ranking of countries by current statistics by years


Comments: