29
/
en
AIzaSyAYiBZKx7MnpbEhh9jyipgxe19OcubqV5w
April 1, 2024
82180
Belgium
BEL
true
2
1
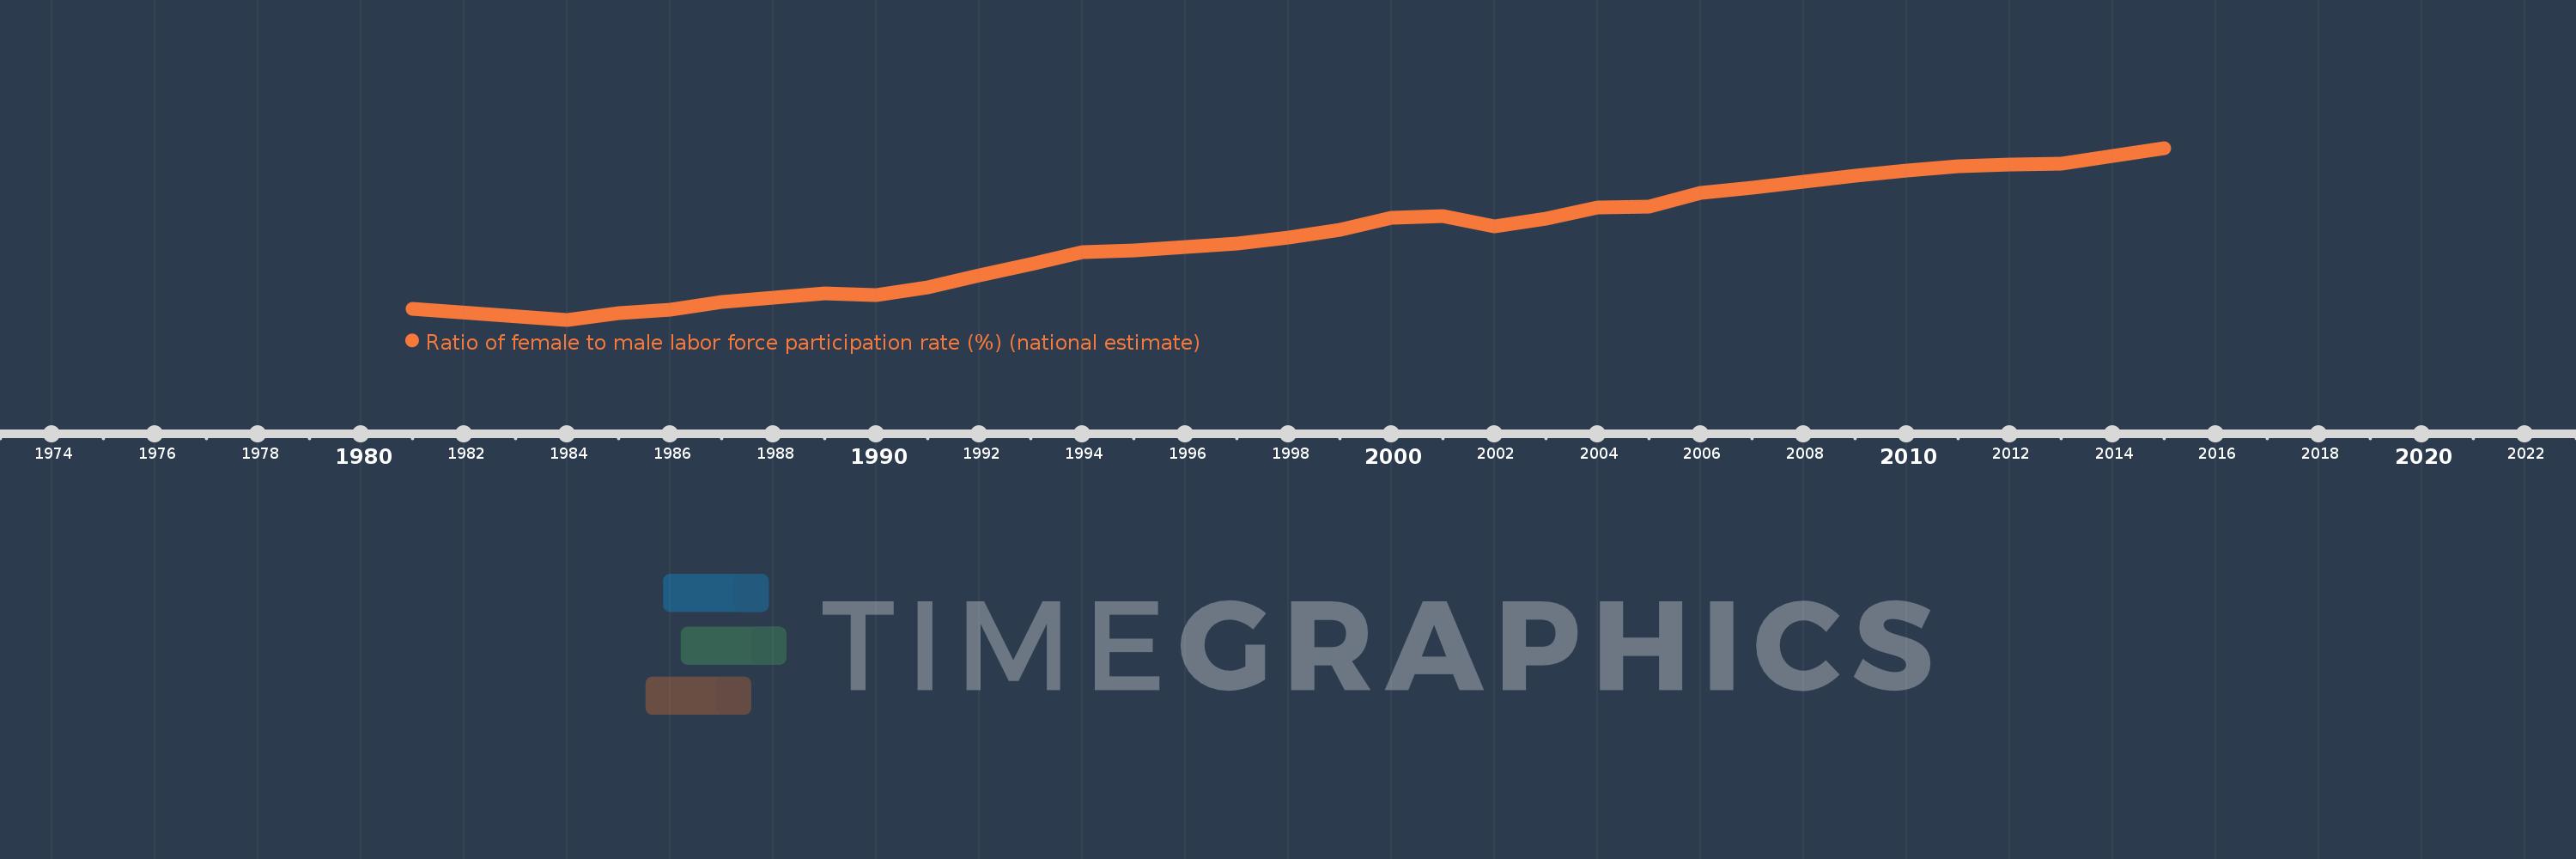
Ratio of female to male labor force participation rate (%) (national estimate)
2015,2014,2013,2012,2011,2010,2009,2008,2007,2006,2005,2004,2003,2002,2001,2000,1999,1998,1997,1996,1995,1994,1993,1992,1991,1990,1989,1988,1987,1986,1985,1984,1981
This statistics in other country:
AfghanistanAlbaniaAlgeriaAmerican SamoaAntigua and BarbudaArab WorldArgentinaArmeniaArubaAustraliaAustriaAzerbaijanBahamas, TheBahrainBangladeshBarbadosBelarusBelgiumBelizeBeninBermudaBhutanBoliviaBosnia and HerzegovinaBotswanaBrazilBritish Virgin IslandsBrunei DarussalamBulgariaBurkina FasoBurundiCabo VerdeCambodiaCameroonCanadaCaribbean small statesCayman IslandsCentral African RepublicCentral Europe and the BalticsChadChileColombiaComorosCongo, Dem. Rep.Congo, Rep.Costa RicaCote d'IvoireCroatiaCubaCyprusCzech RepublicDenmarkDjiboutiDominicaDominican RepublicEarly-demographic dividendEcuadorEgypt, Arab Rep.El SalvadorEquatorial GuineaEstoniaEthiopiaEuro areaEurope & Central AsiaEurope & Central Asia (excluding high income)Europe & Central Asia (IDA & IBRD countries)European UnionFaroe IslandsFijiFinlandFranceFrench PolynesiaGabonGambia, TheGeorgiaGermanyGhanaGibraltarGreeceGrenadaGuamGuatemalaGuineaGuyanaHaitiHigh incomeHondurasHong Kong SAR, ChinaHungaryIBRD onlyIcelandIDA blendIndiaIndonesiaIran, Islamic Rep.IraqIrelandIsle of ManIsraelItalyJamaicaJapanJordanKazakhstanKenyaKiribatiKorea, Rep.KosovoKuwaitKyrgyz RepublicLao PDRLatin America & Caribbean Latin America & Caribbean (excluding high income)Latin America & the Caribbean (IDA & IBRD countries)LatviaLebanonLesothoLiberiaLibyaLiechtensteinLithuaniaLower middle incomeLuxembourgMacao SAR, ChinaMacedonia, FYRMadagascarMalawiMalaysiaMaldivesMaliMaltaMarshall IslandsMauritaniaMauritiusMexicoMiddle East & North AfricaMiddle East & North Africa (excluding high income)Middle East & North Africa (IDA & IBRD countries)MoldovaMonacoMongoliaMontenegroMoroccoMozambiqueMyanmarNamibiaNauruNepalNetherlandsNew CaledoniaNew ZealandNicaraguaNigerNigeriaNorth AmericaNorthern Mariana IslandsNorwayOECD membersOmanPakistanPalauPanamaPapua New GuineaParaguayPeruPhilippinesPolandPortugalPost-demographic dividendPuerto RicoQatarRomaniaRussian FederationRwandaSamoaSan MarinoSao Tome and PrincipeSaudi ArabiaSenegalSerbiaSeychellesSierra LeoneSingaporeSlovak RepublicSloveniaSolomon IslandsSouth AfricaSouth AsiaSouth Asia (IDA & IBRD)South SudanSpainSri LankaSt. Kitts and NevisSt. LuciaSt. Vincent and the GrenadinesSudanSurinameSwazilandSwedenSwitzerlandSyrian Arab RepublicTajikistanTanzaniaThailandTimor-LesteTogoTongaTrinidad and TobagoTunisiaTurkeyTurks and Caicos IslandsTuvaluUgandaUkraineUnited Arab EmiratesUnited KingdomUnited StatesUruguayVanuatuVenezuela, RBVietnamVirgin Islands (U.S.)West Bank and GazaYemen, Rep.ZambiaZimbabwe Timeline:
This timeline shows a graph from 1981 to 2015 of Belgium. No data until 1980. Number of actual observations by date: 33.
Source name:
World Development Indicators
Source organization:
International Labour Organization, Key Indicators of the Labour Market database.
Categories, topics:
Social Protection & Labor
Last updated:
apr 23, 2017
Indicators value changes by year
Minimum:
55.083
jan 1, 1984
At the date of observation
Value
Absolute change
Change from previous value
jan 1, 1981
56.747
+56.747
0.0%
jan 1, 1984
55.083
-1.663
-2.93%
jan 1, 1985
56.056
+0.972
1.77%
jan 1, 1986
56.589
+0.533
0.95%
jan 1, 1987
57.837
+1.248
2.21%
jan 1, 1988
58.466
+0.629
1.09%
jan 1, 1989
59.157
+0.691
1.18%
jan 1, 1990
58.862
-0.295
-0.5%
jan 1, 1991
60.0
+1.138
1.93%
jan 1, 1992
61.889
+1.889
3.15%
jan 1, 1993
63.562
+1.673
2.7%
jan 1, 1994
65.347
+1.784
2.81%
jan 1, 1995
65.686
+0.34
0.52%
jan 1, 1996
66.176
+0.49
0.75%
jan 1, 1997
66.667
+0.49
0.74%
jan 1, 1998
67.545
+0.879
1.32%
jan 1, 1999
68.812
+1.267
1.88%
jan 1, 2000
70.588
+1.776
2.58%
jan 1, 2001
70.894
+0.306
0.43%
jan 1, 2002
69.256
-1.638
-2.31%
jan 1, 2003
70.53
+1.274
1.84%
jan 1, 2004
72.231
+1.702
2.41%
jan 1, 2005
72.34
+0.109
0.15%
jan 1, 2006
74.43
+2.09
2.89%
jan 1, 2007
75.205
+0.775
1.04%
jan 1, 2008
76.105
+0.899
1.2%
jan 1, 2009
77.011
+0.907
1.19%
jan 1, 2010
77.815
+0.803
1.04%
jan 1, 2011
78.454
+0.639
0.82%
jan 1, 2012
78.727
+0.273
0.35%
jan 1, 2013
78.894
+0.168
0.21%
jan 1, 2014
80.067
+1.173
1.49%
jan 1, 2015
81.25
+1.183
1.48%
Ranking of countries by current statistics by years


Comments: