29
/
en
AIzaSyAYiBZKx7MnpbEhh9jyipgxe19OcubqV5w
April 1, 2024
249400
Sri Lanka
LKA
true
2
1
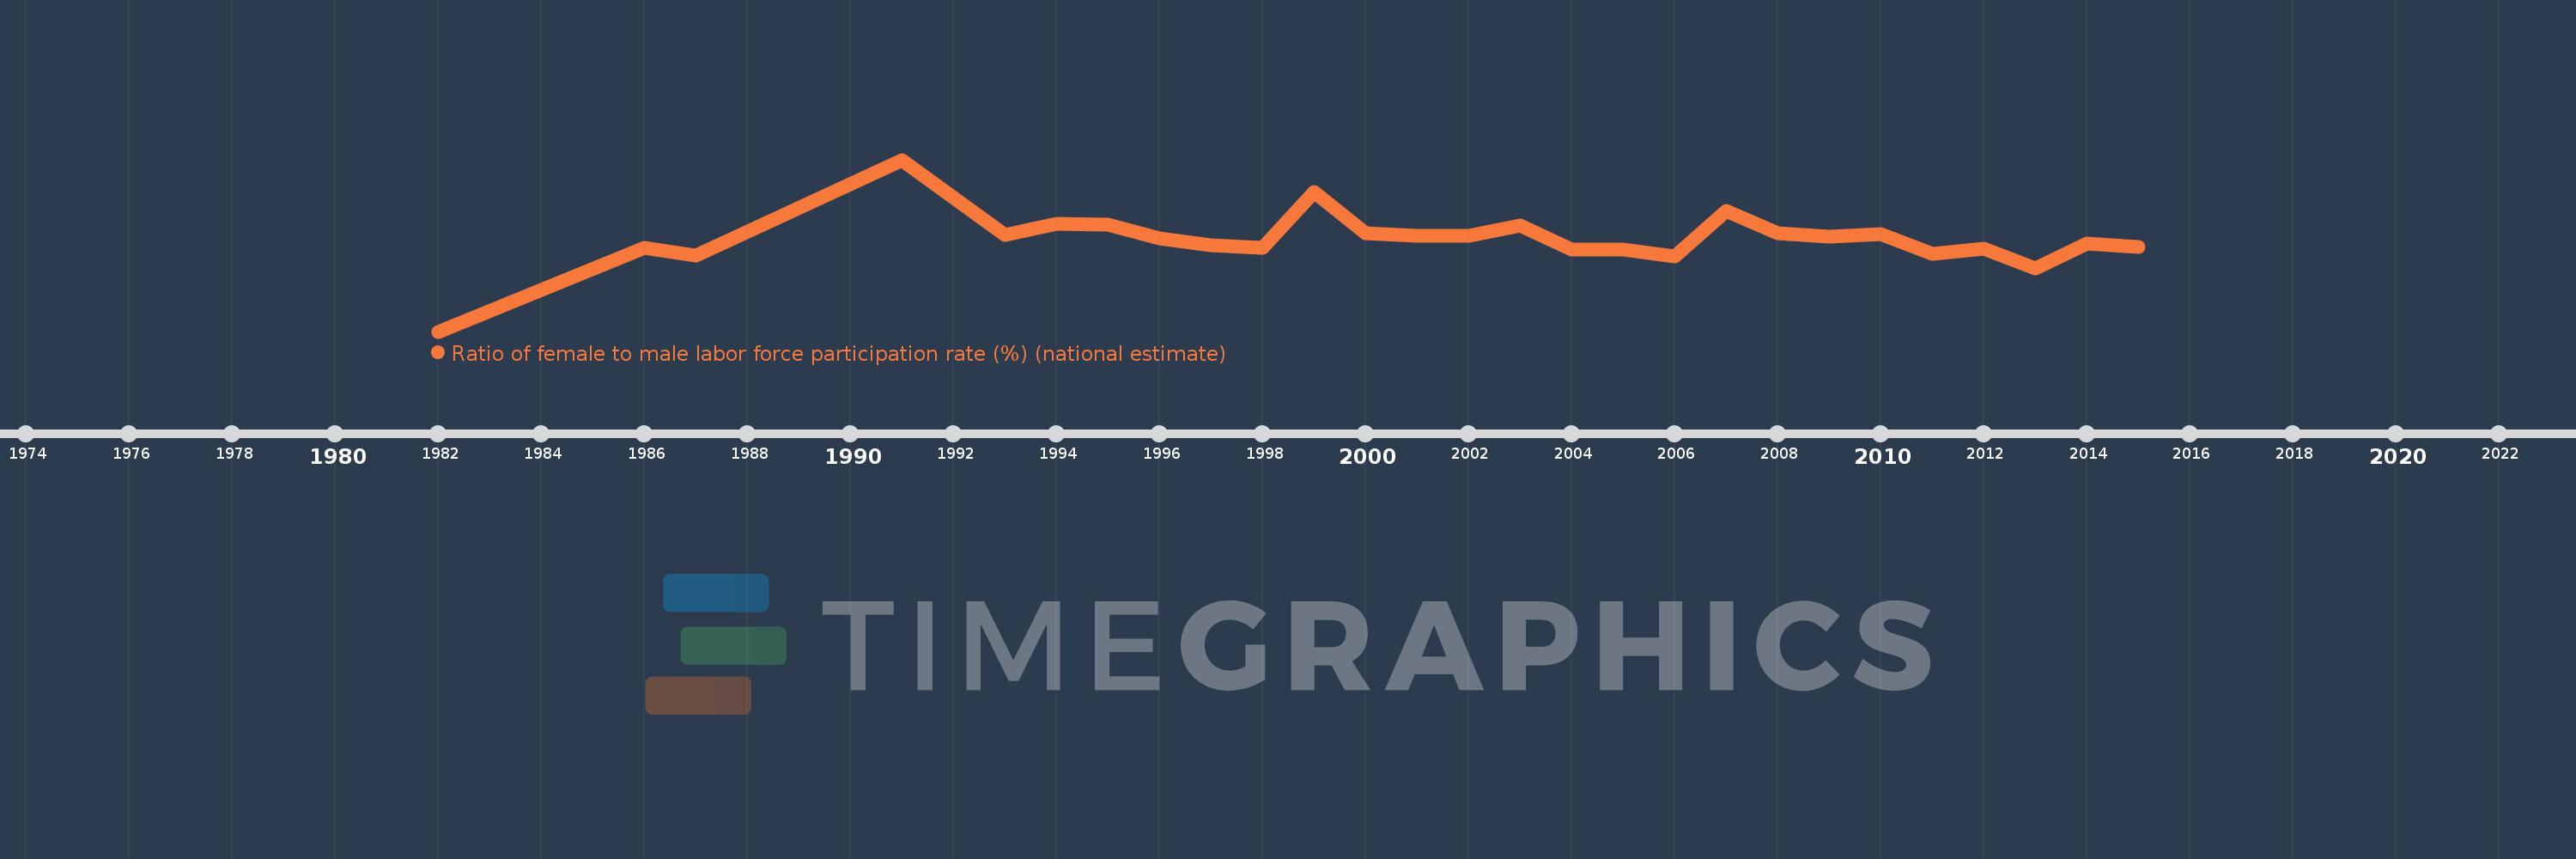
Ratio of female to male labor force participation rate (%) (national estimate)
2015,2014,2013,2012,2011,2010,2009,2008,2007,2006,2005,2004,2003,2002,2001,2000,1999,1998,1997,1996,1995,1994,1993,1991,1987,1986,1982
This statistics in other country:
AfghanistanAlbaniaAlgeriaAmerican SamoaAntigua and BarbudaArab WorldArgentinaArmeniaArubaAustraliaAustriaAzerbaijanBahamas, TheBahrainBangladeshBarbadosBelarusBelgiumBelizeBeninBermudaBhutanBoliviaBosnia and HerzegovinaBotswanaBrazilBritish Virgin IslandsBrunei DarussalamBulgariaBurkina FasoBurundiCabo VerdeCambodiaCameroonCanadaCaribbean small statesCayman IslandsCentral African RepublicCentral Europe and the BalticsChadChileColombiaComorosCongo, Dem. Rep.Congo, Rep.Costa RicaCote d'IvoireCroatiaCubaCyprusCzech RepublicDenmarkDjiboutiDominicaDominican RepublicEarly-demographic dividendEcuadorEgypt, Arab Rep.El SalvadorEquatorial GuineaEstoniaEthiopiaEuro areaEurope & Central AsiaEurope & Central Asia (excluding high income)Europe & Central Asia (IDA & IBRD countries)European UnionFaroe IslandsFijiFinlandFranceFrench PolynesiaGabonGambia, TheGeorgiaGermanyGhanaGibraltarGreeceGrenadaGuamGuatemalaGuineaGuyanaHaitiHigh incomeHondurasHong Kong SAR, ChinaHungaryIBRD onlyIcelandIDA blendIndiaIndonesiaIran, Islamic Rep.IraqIrelandIsle of ManIsraelItalyJamaicaJapanJordanKazakhstanKenyaKiribatiKorea, Rep.KosovoKuwaitKyrgyz RepublicLao PDRLatin America & Caribbean Latin America & Caribbean (excluding high income)Latin America & the Caribbean (IDA & IBRD countries)LatviaLebanonLesothoLiberiaLibyaLiechtensteinLithuaniaLower middle incomeLuxembourgMacao SAR, ChinaMacedonia, FYRMadagascarMalawiMalaysiaMaldivesMaliMaltaMarshall IslandsMauritaniaMauritiusMexicoMiddle East & North AfricaMiddle East & North Africa (excluding high income)Middle East & North Africa (IDA & IBRD countries)MoldovaMonacoMongoliaMontenegroMoroccoMozambiqueMyanmarNamibiaNauruNepalNetherlandsNew CaledoniaNew ZealandNicaraguaNigerNigeriaNorth AmericaNorthern Mariana IslandsNorwayOECD membersOmanPakistanPalauPanamaPapua New GuineaParaguayPeruPhilippinesPolandPortugalPost-demographic dividendPuerto RicoQatarRomaniaRussian FederationRwandaSamoaSan MarinoSao Tome and PrincipeSaudi ArabiaSenegalSerbiaSeychellesSierra LeoneSingaporeSlovak RepublicSloveniaSolomon IslandsSouth AfricaSouth AsiaSouth Asia (IDA & IBRD)South SudanSpainSri LankaSt. Kitts and NevisSt. LuciaSt. Vincent and the GrenadinesSudanSurinameSwazilandSwedenSwitzerlandSyrian Arab RepublicTajikistanTanzaniaThailandTimor-LesteTogoTongaTrinidad and TobagoTunisiaTurkeyTurks and Caicos IslandsTuvaluUgandaUkraineUnited Arab EmiratesUnited KingdomUnited StatesUruguayVanuatuVenezuela, RBVietnamVirgin Islands (U.S.)West Bank and GazaYemen, Rep.ZambiaZimbabwe Timeline:
This timeline shows a graph from 1982 to 2015 of Sri Lanka. No data until 1981. Number of actual observations by date: 27.
Source name:
World Development Indicators
Source organization:
International Labour Organization, Key Indicators of the Labour Market database.
Categories, topics:
Social Protection & Labor
Last updated:
apr 23, 2017
Indicators value changes by year
Minimum:
35.638
jan 1, 1982
Maximum:
58.151
jan 1, 1991
At the date of observation
Value
Absolute change
Change from previous value
jan 1, 1982
35.638
+35.638
0.0%
jan 1, 1986
46.633
+10.995
30.85%
jan 1, 1987
45.592
-1.041
-2.23%
jan 1, 1991
58.151
+12.56
27.55%
jan 1, 1993
48.298
-9.853
-16.94%
jan 1, 1994
49.738
+1.439
2.98%
jan 1, 1995
49.674
-0.063
-0.13%
jan 1, 1996
47.861
-1.813
-3.65%
jan 1, 1997
46.958
-0.903
-1.89%
jan 1, 1998
46.631
-0.326
-0.69%
jan 1, 1999
53.906
+7.275
15.6%
jan 1, 2000
48.516
-5.39
-10.0%
jan 1, 2001
48.217
-0.299
-0.62%
jan 1, 2002
48.187
-0.029
-0.06%
jan 1, 2003
49.485
+1.297
2.69%
jan 1, 2004
46.354
-3.13
-6.33%
jan 1, 2005
46.39
+0.036
0.08%
jan 1, 2006
45.515
-0.876
-1.89%
jan 1, 2007
51.499
+5.985
13.15%
jan 1, 2008
48.556
-2.943
-5.71%
jan 1, 2009
48.095
-0.462
-0.95%
jan 1, 2010
48.461
+0.366
0.76%
jan 1, 2011
45.867
-2.594
-5.35%
jan 1, 2012
46.486
+0.62
1.35%
jan 1, 2013
43.867
-2.62
-5.64%
jan 1, 2014
47.152
+3.286
7.49%
jan 1, 2015
46.703
-0.45
-0.95%
Ranking of countries by current statistics by years


Comments: