29
/
en
AIzaSyAYiBZKx7MnpbEhh9jyipgxe19OcubqV5w
April 1, 2024
208388
Netherlands
NLD
true
2
1
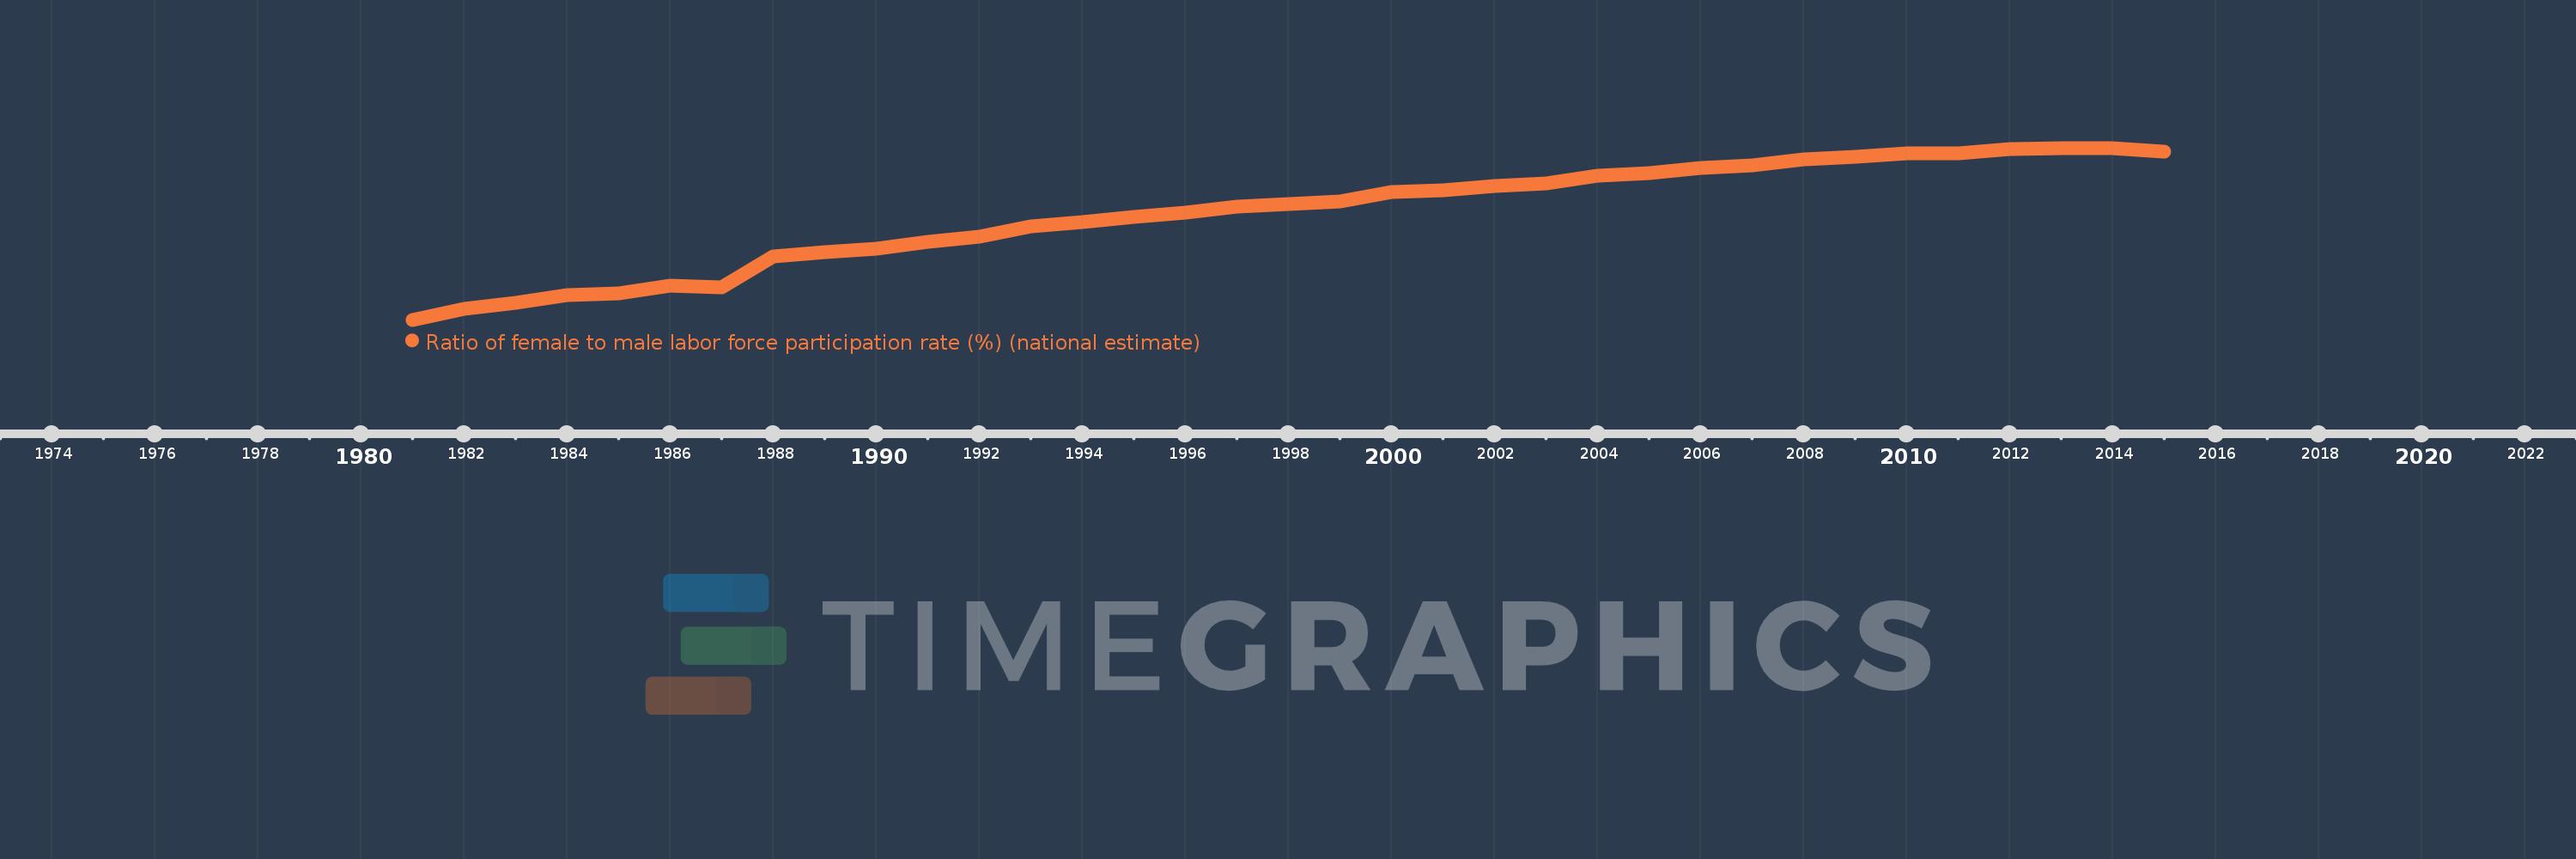
Ratio of female to male labor force participation rate (%) (national estimate)
2015,2014,2013,2012,2011,2010,2009,2008,2007,2006,2005,2004,2003,2002,2001,2000,1999,1998,1997,1996,1995,1994,1993,1992,1991,1990,1989,1988,1987,1986,1985,1984,1983,1982,1981
This statistics in other country:
AfghanistanAlbaniaAlgeriaAmerican SamoaAntigua and BarbudaArab WorldArgentinaArmeniaArubaAustraliaAustriaAzerbaijanBahamas, TheBahrainBangladeshBarbadosBelarusBelgiumBelizeBeninBermudaBhutanBoliviaBosnia and HerzegovinaBotswanaBrazilBritish Virgin IslandsBrunei DarussalamBulgariaBurkina FasoBurundiCabo VerdeCambodiaCameroonCanadaCaribbean small statesCayman IslandsCentral African RepublicCentral Europe and the BalticsChadChileColombiaComorosCongo, Dem. Rep.Congo, Rep.Costa RicaCote d'IvoireCroatiaCubaCyprusCzech RepublicDenmarkDjiboutiDominicaDominican RepublicEarly-demographic dividendEcuadorEgypt, Arab Rep.El SalvadorEquatorial GuineaEstoniaEthiopiaEuro areaEurope & Central AsiaEurope & Central Asia (excluding high income)Europe & Central Asia (IDA & IBRD countries)European UnionFaroe IslandsFijiFinlandFranceFrench PolynesiaGabonGambia, TheGeorgiaGermanyGhanaGibraltarGreeceGrenadaGuamGuatemalaGuineaGuyanaHaitiHigh incomeHondurasHong Kong SAR, ChinaHungaryIBRD onlyIcelandIDA blendIndiaIndonesiaIran, Islamic Rep.IraqIrelandIsle of ManIsraelItalyJamaicaJapanJordanKazakhstanKenyaKiribatiKorea, Rep.KosovoKuwaitKyrgyz RepublicLao PDRLatin America & Caribbean Latin America & Caribbean (excluding high income)Latin America & the Caribbean (IDA & IBRD countries)LatviaLebanonLesothoLiberiaLibyaLiechtensteinLithuaniaLower middle incomeLuxembourgMacao SAR, ChinaMacedonia, FYRMadagascarMalawiMalaysiaMaldivesMaliMaltaMarshall IslandsMauritaniaMauritiusMexicoMiddle East & North AfricaMiddle East & North Africa (excluding high income)Middle East & North Africa (IDA & IBRD countries)MoldovaMonacoMongoliaMontenegroMoroccoMozambiqueMyanmarNamibiaNauruNepalNetherlandsNew CaledoniaNew ZealandNicaraguaNigerNigeriaNorth AmericaNorthern Mariana IslandsNorwayOECD membersOmanPakistanPalauPanamaPapua New GuineaParaguayPeruPhilippinesPolandPortugalPost-demographic dividendPuerto RicoQatarRomaniaRussian FederationRwandaSamoaSan MarinoSao Tome and PrincipeSaudi ArabiaSenegalSerbiaSeychellesSierra LeoneSingaporeSlovak RepublicSloveniaSolomon IslandsSouth AfricaSouth AsiaSouth Asia (IDA & IBRD)South SudanSpainSri LankaSt. Kitts and NevisSt. LuciaSt. Vincent and the GrenadinesSudanSurinameSwazilandSwedenSwitzerlandSyrian Arab RepublicTajikistanTanzaniaThailandTimor-LesteTogoTongaTrinidad and TobagoTunisiaTurkeyTurks and Caicos IslandsTuvaluUgandaUkraineUnited Arab EmiratesUnited KingdomUnited StatesUruguayVanuatuVenezuela, RBVietnamVirgin Islands (U.S.)West Bank and GazaYemen, Rep.ZambiaZimbabwe Timeline:
This timeline shows a graph from 1981 to 2015 of Netherlands. No data until 1980. Number of actual observations by date: 35.
Source name:
World Development Indicators
Source organization:
International Labour Organization, Key Indicators of the Labour Market database.
Categories, topics:
Social Protection & Labor
Last updated:
apr 23, 2017
Indicators value changes by year
Minimum:
43.878
jan 1, 1981
Maximum:
83.685
jan 1, 2013
At the date of observation
Value
Absolute change
Change from previous value
jan 1, 1981
43.878
+43.878
0.0%
jan 1, 1982
46.356
+2.478
5.65%
jan 1, 1983
47.871
+1.515
3.27%
jan 1, 1984
49.563
+1.692
3.53%
jan 1, 1985
50.0
+0.437
0.88%
jan 1, 1986
51.786
+1.786
3.57%
jan 1, 1987
51.437
-0.348
-0.67%
jan 1, 1988
58.451
+7.013
13.64%
jan 1, 1989
59.629
+1.178
2.02%
jan 1, 1990
60.256
+0.627
1.05%
jan 1, 1991
62.006
+1.749
2.9%
jan 1, 1992
63.099
+1.093
1.76%
jan 1, 1993
65.576
+2.478
3.93%
jan 1, 1994
66.476
+0.9
1.37%
jan 1, 1995
67.756
+1.279
1.92%
jan 1, 1996
68.608
+0.852
1.26%
jan 1, 1997
70.028
+1.42
2.07%
jan 1, 1998
70.769
+0.741
1.06%
jan 1, 1999
71.33
+0.56
0.79%
jan 1, 2000
73.407
+2.078
2.91%
jan 1, 2001
73.907
+0.5
0.68%
jan 1, 2002
74.966
+1.059
1.43%
jan 1, 2003
75.439
+0.473
0.63%
jan 1, 2004
77.186
+1.747
2.32%
jan 1, 2005
77.839
+0.653
0.85%
jan 1, 2006
79.063
+1.225
1.57%
jan 1, 2007
79.67
+0.607
0.77%
jan 1, 2008
81.011
+1.341
1.68%
jan 1, 2009
81.608
+0.597
0.74%
jan 1, 2010
82.401
+0.793
0.97%
jan 1, 2011
82.378
-0.023
-0.03%
jan 1, 2012
83.333
+0.956
1.16%
jan 1, 2013
83.685
+0.352
0.42%
jan 1, 2014
83.544
-0.141
-0.17%
jan 1, 2015
82.768
-0.776
-0.93%
Ranking of countries by current statistics by years


Comments: