29
/
en
AIzaSyAYiBZKx7MnpbEhh9jyipgxe19OcubqV5w
April 1, 2024
188440
Malaysia
MYS
true
2
1
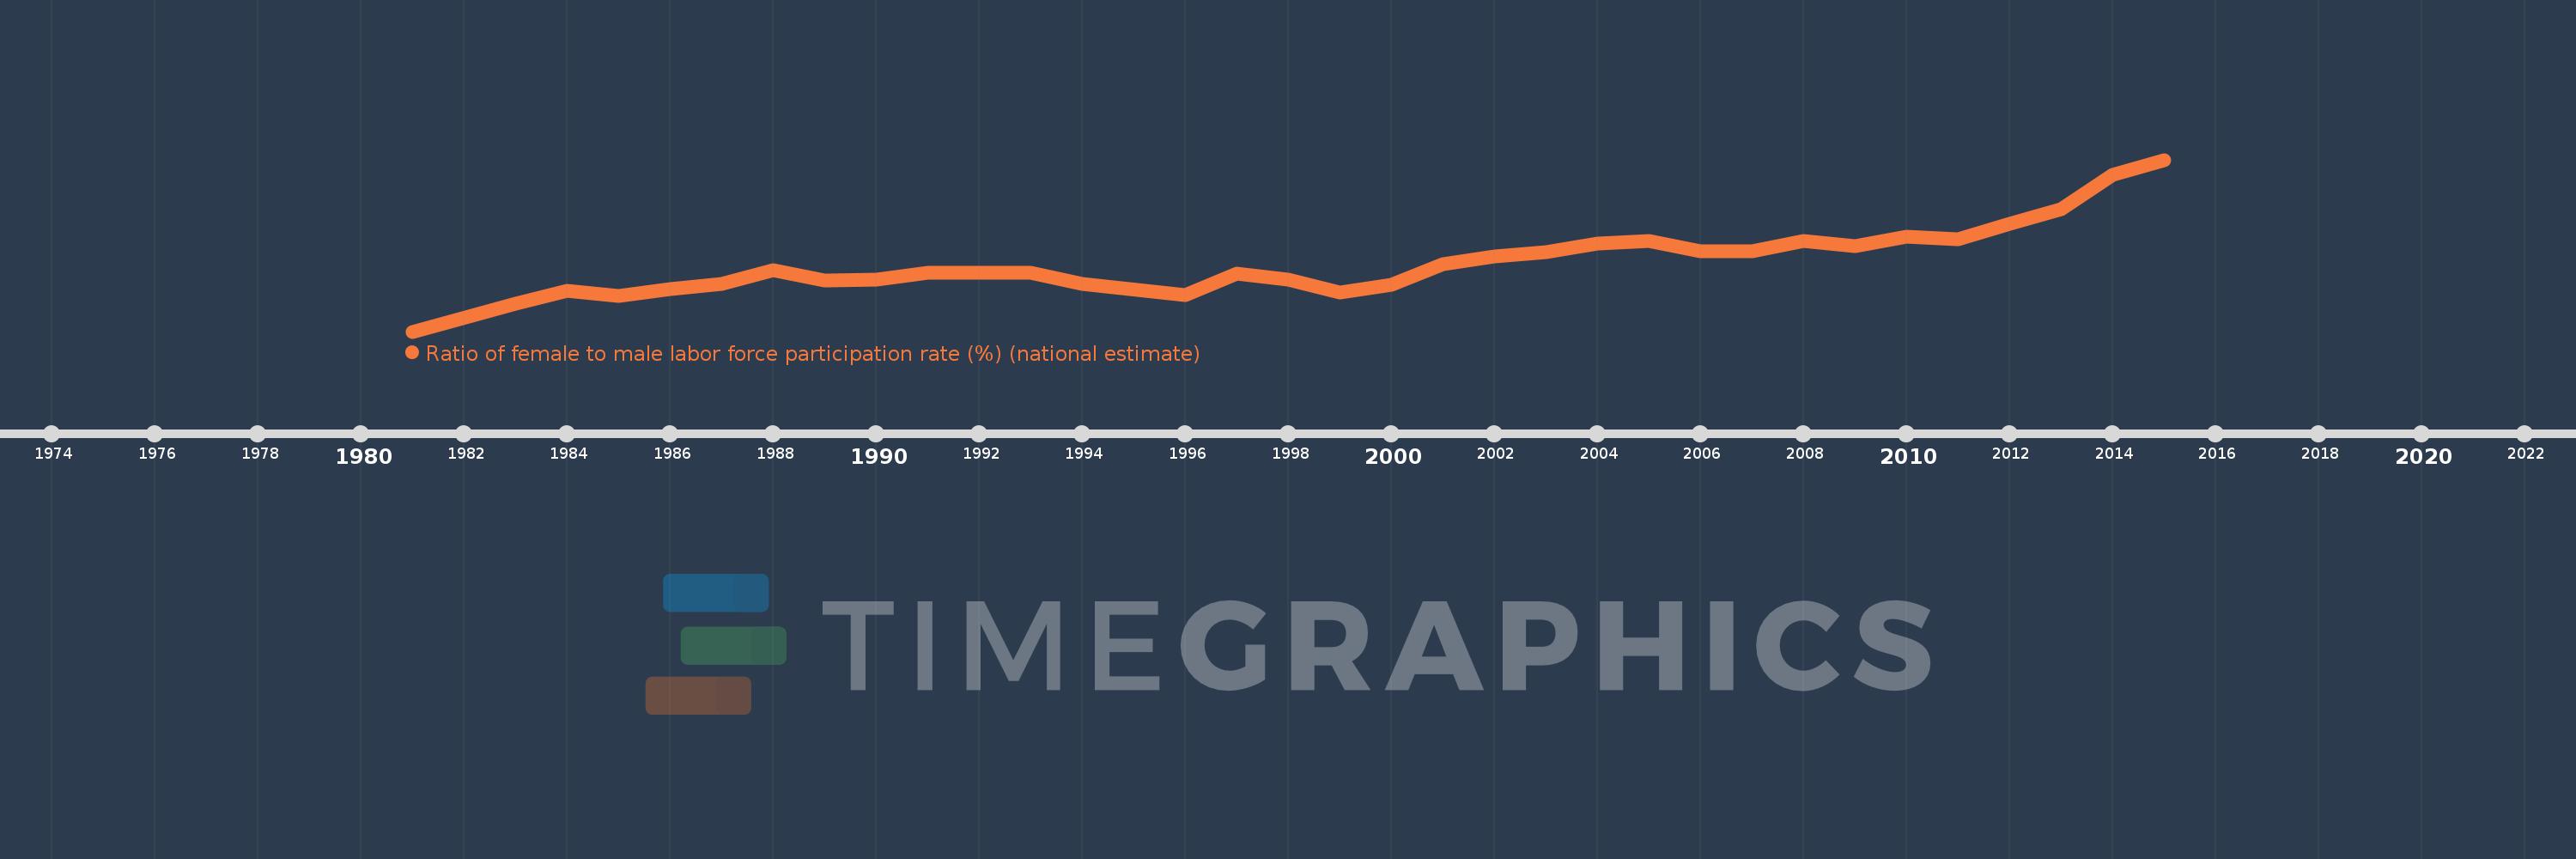
Ratio of female to male labor force participation rate (%) (national estimate)
2015,2014,2013,2012,2011,2010,2009,2008,2007,2006,2005,2004,2003,2002,2001,2000,1999,1998,1997,1996,1994,1993,1991,1990,1989,1988,1987,1986,1985,1984,1983,1981
This statistics in other country:
AfghanistanAlbaniaAlgeriaAmerican SamoaAntigua and BarbudaArab WorldArgentinaArmeniaArubaAustraliaAustriaAzerbaijanBahamas, TheBahrainBangladeshBarbadosBelarusBelgiumBelizeBeninBermudaBhutanBoliviaBosnia and HerzegovinaBotswanaBrazilBritish Virgin IslandsBrunei DarussalamBulgariaBurkina FasoBurundiCabo VerdeCambodiaCameroonCanadaCaribbean small statesCayman IslandsCentral African RepublicCentral Europe and the BalticsChadChileColombiaComorosCongo, Dem. Rep.Congo, Rep.Costa RicaCote d'IvoireCroatiaCubaCyprusCzech RepublicDenmarkDjiboutiDominicaDominican RepublicEarly-demographic dividendEcuadorEgypt, Arab Rep.El SalvadorEquatorial GuineaEstoniaEthiopiaEuro areaEurope & Central AsiaEurope & Central Asia (excluding high income)Europe & Central Asia (IDA & IBRD countries)European UnionFaroe IslandsFijiFinlandFranceFrench PolynesiaGabonGambia, TheGeorgiaGermanyGhanaGibraltarGreeceGrenadaGuamGuatemalaGuineaGuyanaHaitiHigh incomeHondurasHong Kong SAR, ChinaHungaryIBRD onlyIcelandIDA blendIndiaIndonesiaIran, Islamic Rep.IraqIrelandIsle of ManIsraelItalyJamaicaJapanJordanKazakhstanKenyaKiribatiKorea, Rep.KosovoKuwaitKyrgyz RepublicLao PDRLatin America & Caribbean Latin America & Caribbean (excluding high income)Latin America & the Caribbean (IDA & IBRD countries)LatviaLebanonLesothoLiberiaLibyaLiechtensteinLithuaniaLower middle incomeLuxembourgMacao SAR, ChinaMacedonia, FYRMadagascarMalawiMalaysiaMaldivesMaliMaltaMarshall IslandsMauritaniaMauritiusMexicoMiddle East & North AfricaMiddle East & North Africa (excluding high income)Middle East & North Africa (IDA & IBRD countries)MoldovaMonacoMongoliaMontenegroMoroccoMozambiqueMyanmarNamibiaNauruNepalNetherlandsNew CaledoniaNew ZealandNicaraguaNigerNigeriaNorth AmericaNorthern Mariana IslandsNorwayOECD membersOmanPakistanPalauPanamaPapua New GuineaParaguayPeruPhilippinesPolandPortugalPost-demographic dividendPuerto RicoQatarRomaniaRussian FederationRwandaSamoaSan MarinoSao Tome and PrincipeSaudi ArabiaSenegalSerbiaSeychellesSierra LeoneSingaporeSlovak RepublicSloveniaSolomon IslandsSouth AfricaSouth AsiaSouth Asia (IDA & IBRD)South SudanSpainSri LankaSt. Kitts and NevisSt. LuciaSt. Vincent and the GrenadinesSudanSurinameSwazilandSwedenSwitzerlandSyrian Arab RepublicTajikistanTanzaniaThailandTimor-LesteTogoTongaTrinidad and TobagoTunisiaTurkeyTurks and Caicos IslandsTuvaluUgandaUkraineUnited Arab EmiratesUnited KingdomUnited StatesUruguayVanuatuVenezuela, RBVietnamVirgin Islands (U.S.)West Bank and GazaYemen, Rep.ZambiaZimbabwe Timeline:
This timeline shows a graph from 1981 to 2015 of Malaysia. No data until 1980. Number of actual observations by date: 32.
Source name:
World Development Indicators
Source organization:
International Labour Organization, Key Indicators of the Labour Market database.
Categories, topics:
Social Protection & Labor
Last updated:
apr 23, 2017
Indicators value changes by year
Minimum:
49.384
jan 1, 1981
Maximum:
66.419
jan 1, 2015
At the date of observation
Value
Absolute change
Change from previous value
jan 1, 1981
49.384
+49.384
0.0%
jan 1, 1983
52.169
+2.785
5.64%
jan 1, 1984
53.388
+1.219
2.34%
jan 1, 1985
52.927
-0.46
-0.86%
jan 1, 1986
53.621
+0.694
1.31%
jan 1, 1987
54.079
+0.458
0.85%
jan 1, 1988
55.491
+1.411
2.61%
jan 1, 1989
54.489
-1.002
-1.81%
jan 1, 1990
54.556
+0.067
0.12%
jan 1, 1991
55.189
+0.633
1.16%
jan 1, 1993
55.241
+0.052
0.09%
jan 1, 1994
54.07
-1.172
-2.12%
jan 1, 1996
53.025
-1.045
-1.93%
jan 1, 1997
55.124
+2.099
3.96%
jan 1, 1998
54.567
-0.557
-1.01%
jan 1, 1999
53.301
-1.266
-2.32%
jan 1, 2000
53.986
+0.684
1.28%
jan 1, 2001
56.062
+2.077
3.85%
jan 1, 2002
56.865
+0.803
1.43%
jan 1, 2003
57.301
+0.435
0.77%
jan 1, 2004
58.1
+0.799
1.39%
jan 1, 2005
58.344
+0.244
0.42%
jan 1, 2006
57.375
-0.969
-1.66%
jan 1, 2007
57.322
-0.053
-0.09%
jan 1, 2008
58.365
+1.043
1.82%
jan 1, 2009
57.848
-0.517
-0.89%
jan 1, 2010
58.809
+0.961
1.66%
jan 1, 2011
58.577
-0.232
-0.39%
jan 1, 2012
60.1
+1.524
2.6%
jan 1, 2013
61.491
+1.39
2.31%
jan 1, 2014
64.932
+3.441
5.6%
jan 1, 2015
66.419
+1.487
2.29%
Ranking of countries by current statistics by years


Comments: