29
/
en
AIzaSyAYiBZKx7MnpbEhh9jyipgxe19OcubqV5w
April 1, 2024
247997
Spain
ESP
true
2
1
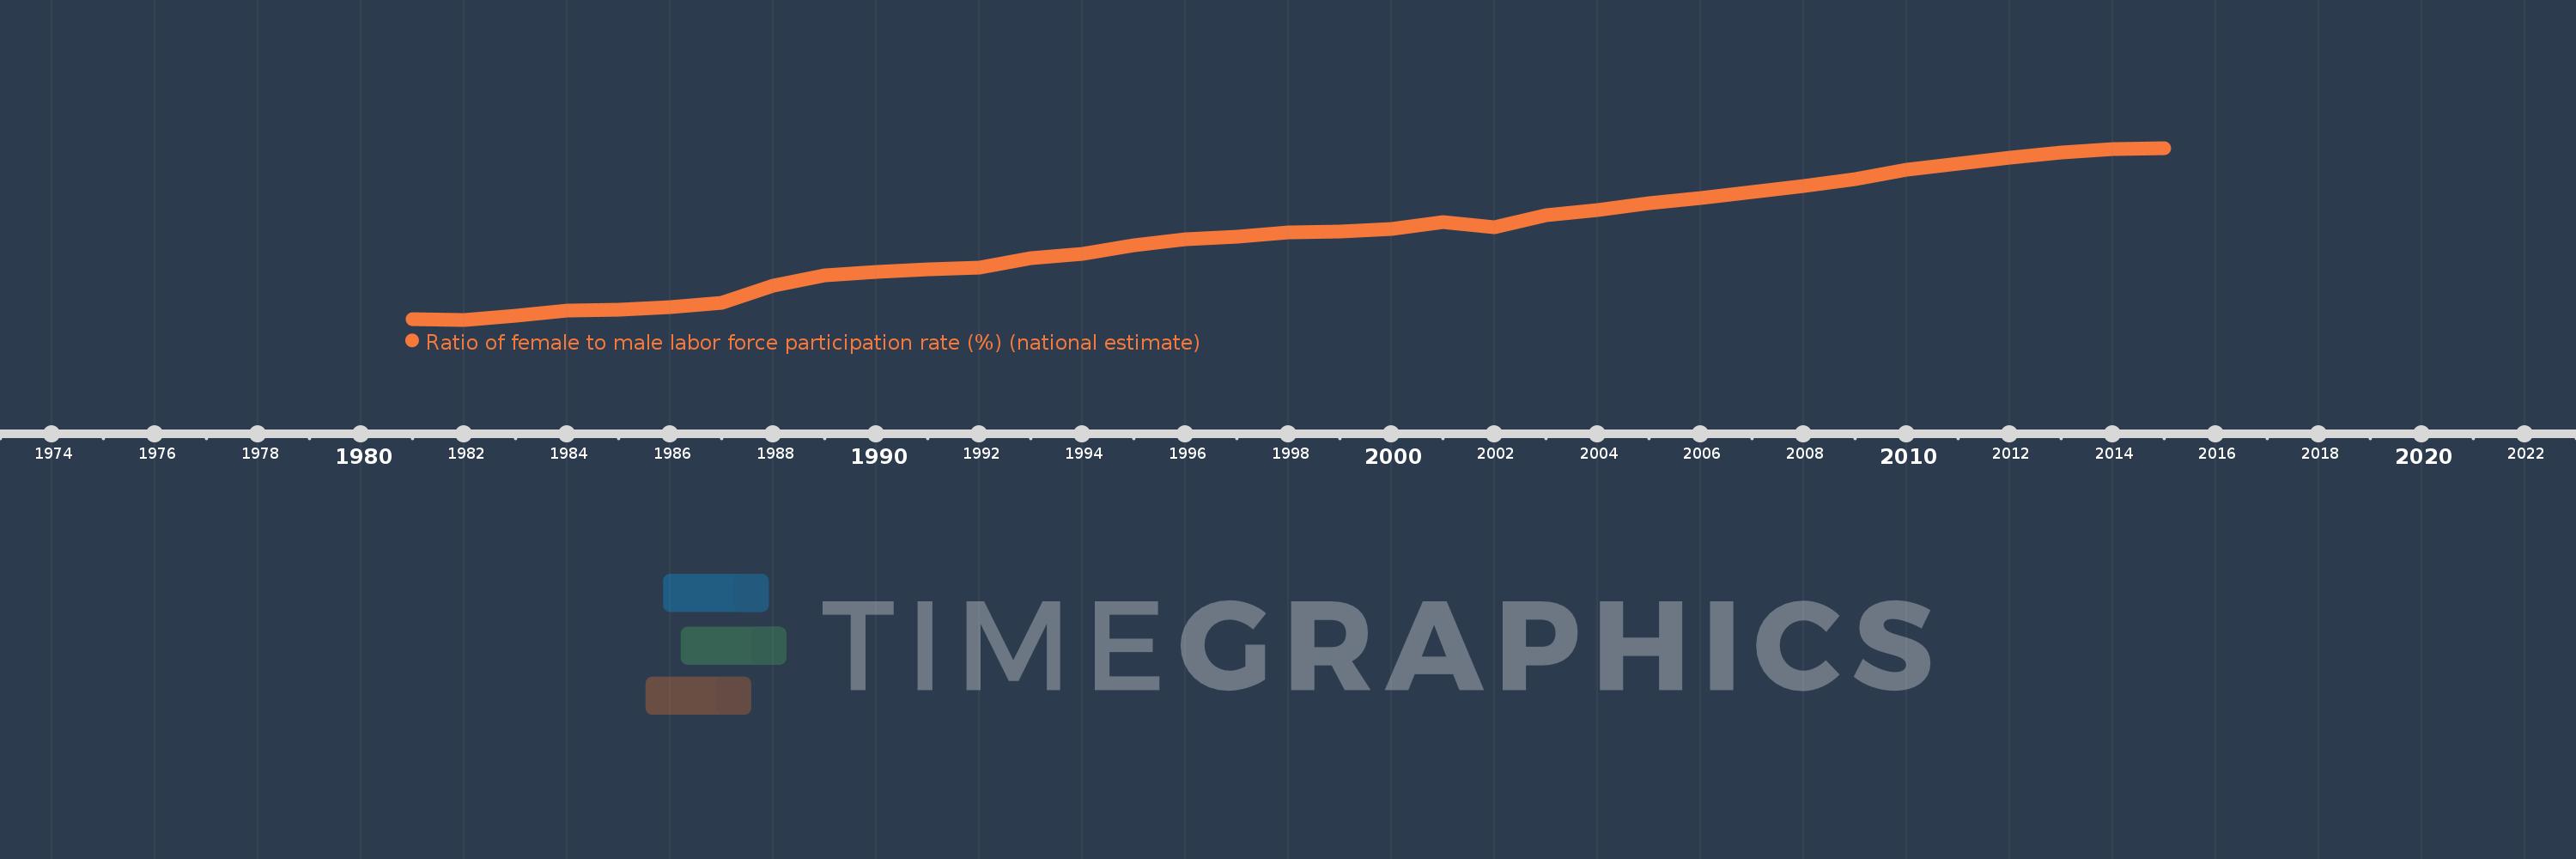
Ratio of female to male labor force participation rate (%) (national estimate)
2015,2014,2013,2012,2011,2010,2009,2008,2007,2006,2005,2004,2003,2002,2001,2000,1999,1998,1997,1996,1995,1994,1993,1992,1991,1990,1989,1988,1987,1986,1985,1984,1983,1982,1981
This statistics in other country:
AfghanistanAlbaniaAlgeriaAmerican SamoaAntigua and BarbudaArab WorldArgentinaArmeniaArubaAustraliaAustriaAzerbaijanBahamas, TheBahrainBangladeshBarbadosBelarusBelgiumBelizeBeninBermudaBhutanBoliviaBosnia and HerzegovinaBotswanaBrazilBritish Virgin IslandsBrunei DarussalamBulgariaBurkina FasoBurundiCabo VerdeCambodiaCameroonCanadaCaribbean small statesCayman IslandsCentral African RepublicCentral Europe and the BalticsChadChileColombiaComorosCongo, Dem. Rep.Congo, Rep.Costa RicaCote d'IvoireCroatiaCubaCyprusCzech RepublicDenmarkDjiboutiDominicaDominican RepublicEarly-demographic dividendEcuadorEgypt, Arab Rep.El SalvadorEquatorial GuineaEstoniaEthiopiaEuro areaEurope & Central AsiaEurope & Central Asia (excluding high income)Europe & Central Asia (IDA & IBRD countries)European UnionFaroe IslandsFijiFinlandFranceFrench PolynesiaGabonGambia, TheGeorgiaGermanyGhanaGibraltarGreeceGrenadaGuamGuatemalaGuineaGuyanaHaitiHigh incomeHondurasHong Kong SAR, ChinaHungaryIBRD onlyIcelandIDA blendIndiaIndonesiaIran, Islamic Rep.IraqIrelandIsle of ManIsraelItalyJamaicaJapanJordanKazakhstanKenyaKiribatiKorea, Rep.KosovoKuwaitKyrgyz RepublicLao PDRLatin America & Caribbean Latin America & Caribbean (excluding high income)Latin America & the Caribbean (IDA & IBRD countries)LatviaLebanonLesothoLiberiaLibyaLiechtensteinLithuaniaLower middle incomeLuxembourgMacao SAR, ChinaMacedonia, FYRMadagascarMalawiMalaysiaMaldivesMaliMaltaMarshall IslandsMauritaniaMauritiusMexicoMiddle East & North AfricaMiddle East & North Africa (excluding high income)Middle East & North Africa (IDA & IBRD countries)MoldovaMonacoMongoliaMontenegroMoroccoMozambiqueMyanmarNamibiaNauruNepalNetherlandsNew CaledoniaNew ZealandNicaraguaNigerNigeriaNorth AmericaNorthern Mariana IslandsNorwayOECD membersOmanPakistanPalauPanamaPapua New GuineaParaguayPeruPhilippinesPolandPortugalPost-demographic dividendPuerto RicoQatarRomaniaRussian FederationRwandaSamoaSan MarinoSao Tome and PrincipeSaudi ArabiaSenegalSerbiaSeychellesSierra LeoneSingaporeSlovak RepublicSloveniaSolomon IslandsSouth AfricaSouth AsiaSouth Asia (IDA & IBRD)South SudanSpainSri LankaSt. Kitts and NevisSt. LuciaSt. Vincent and the GrenadinesSudanSurinameSwazilandSwedenSwitzerlandSyrian Arab RepublicTajikistanTanzaniaThailandTimor-LesteTogoTongaTrinidad and TobagoTunisiaTurkeyTurks and Caicos IslandsTuvaluUgandaUkraineUnited Arab EmiratesUnited KingdomUnited StatesUruguayVanuatuVenezuela, RBVietnamVirgin Islands (U.S.)West Bank and GazaYemen, Rep.ZambiaZimbabwe Timeline:
This timeline shows a graph from 1981 to 2015 of Spain. No data until 1980. Number of actual observations by date: 35.
Source name:
World Development Indicators
Source organization:
International Labour Organization, Key Indicators of the Labour Market database.
Categories, topics:
Social Protection & Labor
Last updated:
apr 23, 2017
Indicators value changes by year
Minimum:
36.005
jan 1, 1982
Maximum:
81.692
jan 1, 2015
At the date of observation
Value
Absolute change
Change from previous value
jan 1, 1981
36.198
+36.198
0.0%
jan 1, 1982
36.005
-0.193
-0.53%
jan 1, 1983
37.003
+0.997
2.77%
jan 1, 1984
38.338
+1.335
3.61%
jan 1, 1985
38.753
+0.416
1.08%
jan 1, 1986
39.477
+0.724
1.87%
jan 1, 1987
40.616
+1.139
2.88%
jan 1, 1988
45.156
+4.541
11.18%
jan 1, 1989
47.813
+2.656
5.88%
jan 1, 1990
48.632
+0.819
1.71%
jan 1, 1991
49.319
+0.687
1.41%
jan 1, 1992
49.923
+0.604
1.23%
jan 1, 1993
52.345
+2.422
4.85%
jan 1, 1994
53.506
+1.161
2.22%
jan 1, 1995
55.76
+2.254
4.21%
jan 1, 1996
57.321
+1.561
2.8%
jan 1, 1997
58.009
+0.688
1.2%
jan 1, 1998
59.161
+1.152
1.99%
jan 1, 1999
59.443
+0.281
0.48%
jan 1, 2000
60.247
+0.804
1.35%
jan 1, 2001
62.043
+1.796
2.98%
jan 1, 2002
60.643
-1.4
-2.26%
jan 1, 2003
63.788
+3.145
5.19%
jan 1, 2004
65.269
+1.482
2.32%
jan 1, 2005
66.964
+1.695
2.6%
jan 1, 2006
68.282
+1.318
1.97%
jan 1, 2007
70.029
+1.747
2.56%
jan 1, 2008
71.533
+1.504
2.15%
jan 1, 2009
73.362
+1.83
2.56%
jan 1, 2010
75.811
+2.449
3.34%
jan 1, 2011
77.563
+1.752
2.31%
jan 1, 2012
79.042
+1.479
1.91%
jan 1, 2013
80.543
+1.501
1.9%
jan 1, 2014
81.402
+0.859
1.07%
jan 1, 2015
81.692
+0.29
0.36%
Ranking of countries by current statistics by years


Comments: