29
/
en
AIzaSyAYiBZKx7MnpbEhh9jyipgxe19OcubqV5w
April 1, 2024
214743
Norway
NOR
true
2
1
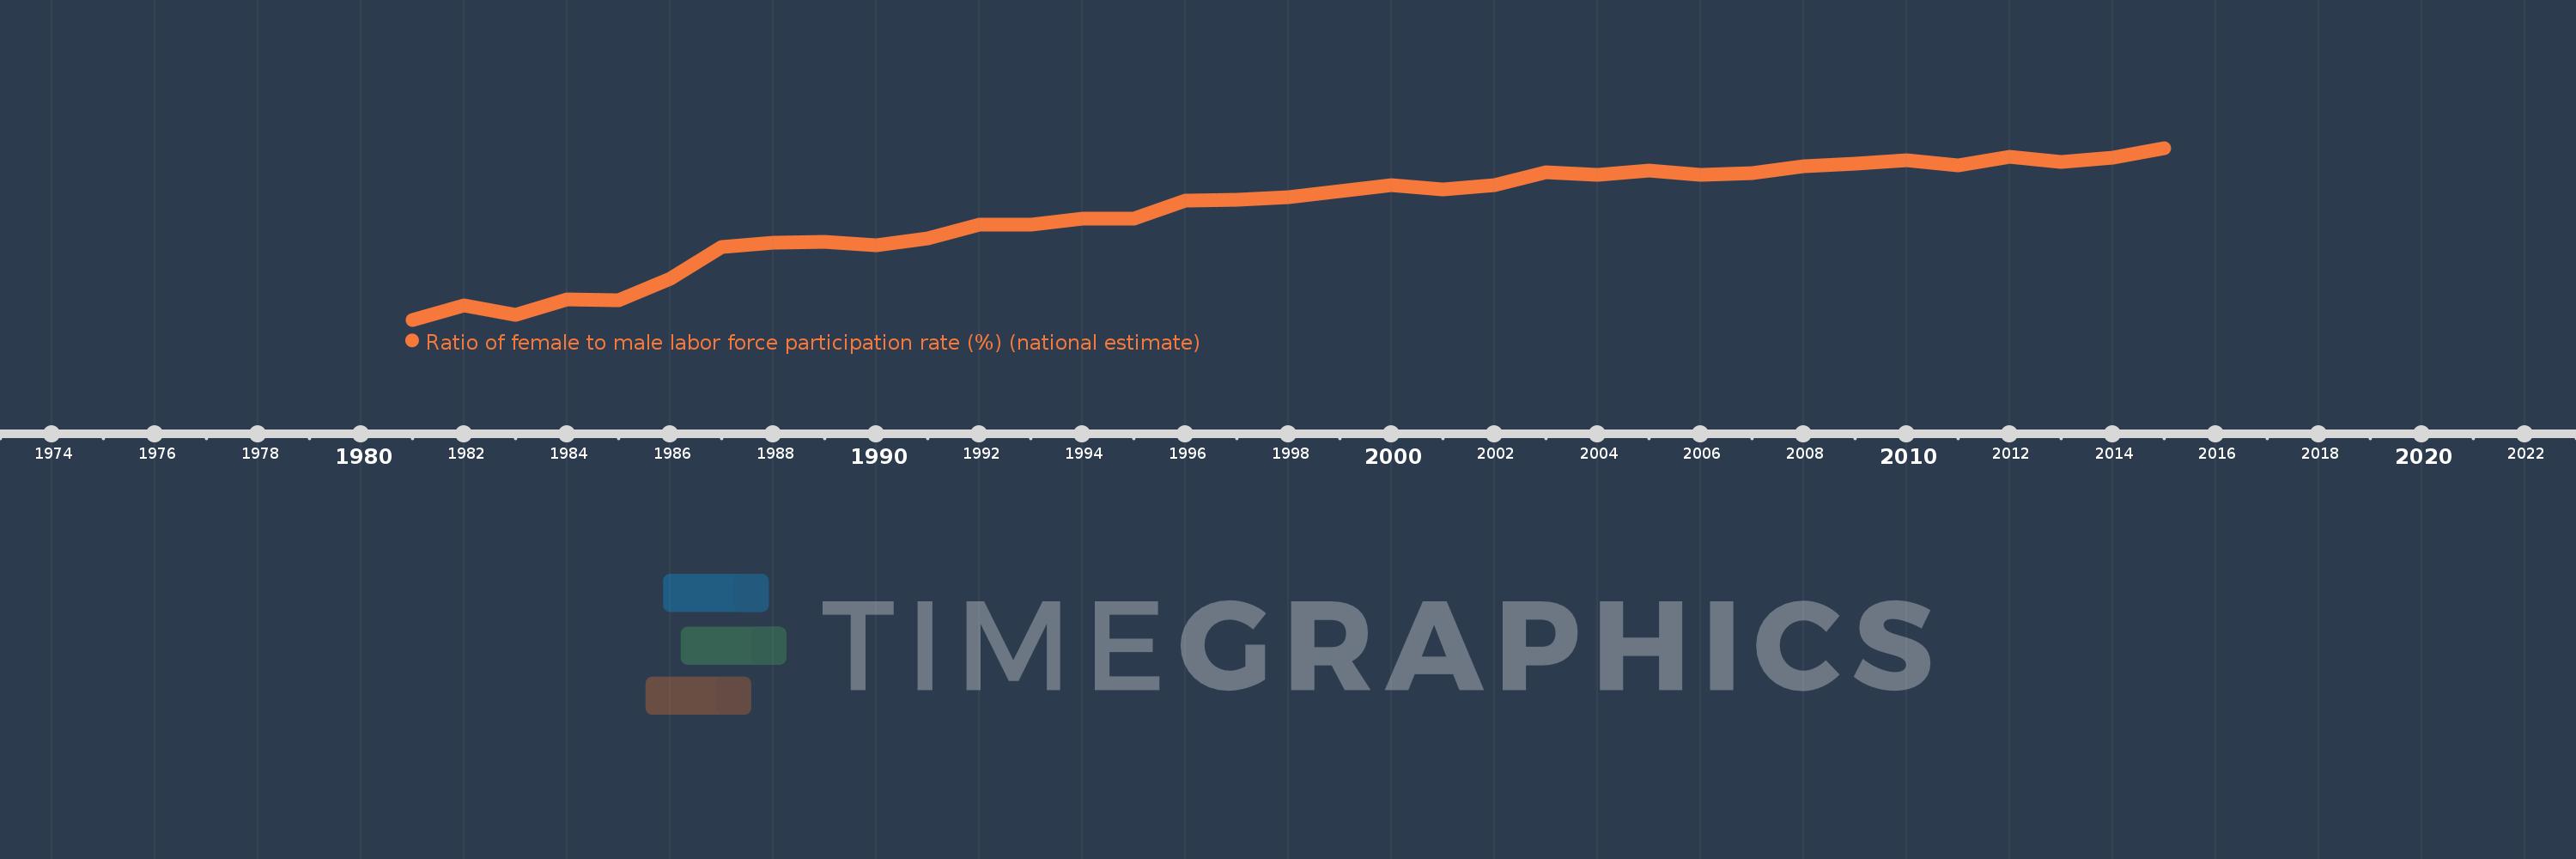
Ratio of female to male labor force participation rate (%) (national estimate)
2015,2014,2013,2012,2011,2010,2009,2008,2007,2006,2005,2004,2003,2002,2001,2000,1999,1998,1997,1996,1995,1994,1993,1992,1991,1990,1989,1988,1987,1986,1985,1984,1983,1982,1981
This statistics in other country:
AfghanistanAlbaniaAlgeriaAmerican SamoaAntigua and BarbudaArab WorldArgentinaArmeniaArubaAustraliaAustriaAzerbaijanBahamas, TheBahrainBangladeshBarbadosBelarusBelgiumBelizeBeninBermudaBhutanBoliviaBosnia and HerzegovinaBotswanaBrazilBritish Virgin IslandsBrunei DarussalamBulgariaBurkina FasoBurundiCabo VerdeCambodiaCameroonCanadaCaribbean small statesCayman IslandsCentral African RepublicCentral Europe and the BalticsChadChileColombiaComorosCongo, Dem. Rep.Congo, Rep.Costa RicaCote d'IvoireCroatiaCubaCyprusCzech RepublicDenmarkDjiboutiDominicaDominican RepublicEarly-demographic dividendEcuadorEgypt, Arab Rep.El SalvadorEquatorial GuineaEstoniaEthiopiaEuro areaEurope & Central AsiaEurope & Central Asia (excluding high income)Europe & Central Asia (IDA & IBRD countries)European UnionFaroe IslandsFijiFinlandFranceFrench PolynesiaGabonGambia, TheGeorgiaGermanyGhanaGibraltarGreeceGrenadaGuamGuatemalaGuineaGuyanaHaitiHigh incomeHondurasHong Kong SAR, ChinaHungaryIBRD onlyIcelandIDA blendIndiaIndonesiaIran, Islamic Rep.IraqIrelandIsle of ManIsraelItalyJamaicaJapanJordanKazakhstanKenyaKiribatiKorea, Rep.KosovoKuwaitKyrgyz RepublicLao PDRLatin America & Caribbean Latin America & Caribbean (excluding high income)Latin America & the Caribbean (IDA & IBRD countries)LatviaLebanonLesothoLiberiaLibyaLiechtensteinLithuaniaLower middle incomeLuxembourgMacao SAR, ChinaMacedonia, FYRMadagascarMalawiMalaysiaMaldivesMaliMaltaMarshall IslandsMauritaniaMauritiusMexicoMiddle East & North AfricaMiddle East & North Africa (excluding high income)Middle East & North Africa (IDA & IBRD countries)MoldovaMonacoMongoliaMontenegroMoroccoMozambiqueMyanmarNamibiaNauruNepalNetherlandsNew CaledoniaNew ZealandNicaraguaNigerNigeriaNorth AmericaNorthern Mariana IslandsNorwayOECD membersOmanPakistanPalauPanamaPapua New GuineaParaguayPeruPhilippinesPolandPortugalPost-demographic dividendPuerto RicoQatarRomaniaRussian FederationRwandaSamoaSan MarinoSao Tome and PrincipeSaudi ArabiaSenegalSerbiaSeychellesSierra LeoneSingaporeSlovak RepublicSloveniaSolomon IslandsSouth AfricaSouth AsiaSouth Asia (IDA & IBRD)South SudanSpainSri LankaSt. Kitts and NevisSt. LuciaSt. Vincent and the GrenadinesSudanSurinameSwazilandSwedenSwitzerlandSyrian Arab RepublicTajikistanTanzaniaThailandTimor-LesteTogoTongaTrinidad and TobagoTunisiaTurkeyTurks and Caicos IslandsTuvaluUgandaUkraineUnited Arab EmiratesUnited KingdomUnited StatesUruguayVanuatuVenezuela, RBVietnamVirgin Islands (U.S.)West Bank and GazaYemen, Rep.ZambiaZimbabwe Timeline:
This timeline shows a graph from 1981 to 2015 of Norway. No data until 1980. Number of actual observations by date: 35.
Source name:
World Development Indicators
Source organization:
International Labour Organization, Key Indicators of the Labour Market database.
Categories, topics:
Social Protection & Labor
Last updated:
apr 23, 2017
Indicators value changes by year
Minimum:
70.483
jan 1, 1981
Maximum:
94.012
jan 1, 2015
At the date of observation
Value
Absolute change
Change from previous value
jan 1, 1981
70.483
+70.483
0.0%
jan 1, 1982
72.414
+1.93
2.74%
jan 1, 1983
71.103
-1.311
-1.81%
jan 1, 1984
73.241
+2.139
3.01%
jan 1, 1985
73.125
-0.116
-0.16%
jan 1, 1986
76.046
+2.921
3.99%
jan 1, 1987
80.485
+4.439
5.84%
jan 1, 1988
81.084
+0.6
0.75%
jan 1, 1989
81.146
+0.062
0.08%
jan 1, 1990
80.724
-0.422
-0.52%
jan 1, 1991
81.569
+0.844
1.05%
jan 1, 1992
83.512
+1.943
2.38%
jan 1, 1993
83.49
-0.022
-0.03%
jan 1, 1994
84.303
+0.813
0.97%
jan 1, 1995
84.388
+0.085
0.1%
jan 1, 1996
86.81
+2.423
2.87%
jan 1, 1997
86.974
+0.163
0.19%
jan 1, 1998
87.259
+0.285
0.33%
jan 1, 1999
88.153
+0.894
1.02%
jan 1, 2000
88.946
+0.793
0.9%
jan 1, 2001
88.378
-0.568
-0.64%
jan 1, 2002
88.875
+0.497
0.56%
jan 1, 2003
90.734
+1.859
2.09%
jan 1, 2004
90.327
-0.407
-0.45%
jan 1, 2005
90.921
+0.594
0.66%
jan 1, 2006
90.369
-0.552
-0.61%
jan 1, 2007
90.584
+0.214
0.24%
jan 1, 2008
91.557
+0.973
1.07%
jan 1, 2009
91.808
+0.251
0.27%
jan 1, 2010
92.318
+0.51
0.56%
jan 1, 2011
91.589
-0.729
-0.79%
jan 1, 2012
92.828
+1.239
1.35%
jan 1, 2013
92.059
-0.769
-0.83%
jan 1, 2014
92.673
+0.614
0.67%
jan 1, 2015
94.012
+1.339
1.44%
Ranking of countries by current statistics by years


Comments: